> ## Documentation Index
> Fetch the complete documentation index at: https://docs.zionapp.co/llms.txt
> Use this file to discover all available pages before exploring further.
# Trends, subjects, and centres
> Time-series goal-achievement trends, subject performance analysis, and centre comparison, with exportable tables and charts
Trends, Subjects, and Centres are three linked analytics surfaces inside Zion. Together they show how goal achievement moves over time, how it breaks down by subject, and how learning centres compare to each other. Administrators see data across the whole organization. Supervisors see the same charts and tables scoped to their assigned centre(s) only.
For AI-generated pattern detection (day-of-week trends, subject correlations, seasonal shifts) and termly-goal projections, see [Insights Overview](/features/insights/overview) and [Predictions](/features/insights/predictions). This page covers the trend, subject, and centre reporting surfaces.
## Accessing the analytics hub
Navigate to **Analytics** from the sidebar. Administrators land on the analytics index with quick-link cards to Trends, Subjects, Centres, Predictions, and Insights, plus a student picker.
Click **Trends**, **Subjects**, or **Centres** to open that view. Supervisors reach Trends directly from their own sidebar and see only data for their assigned centre(s).
From the analytics index, use the student picker to open an individual student's trend detail page.
Sees org-wide data across all centres for Trends, Subjects, and Centres.
Sees Trends scoped automatically to their assigned centre(s). A supervisor with no assigned centres sees empty data, never organization-wide totals.
***
## Trends
### Time-series achievement chart
The trend chart plots goal-achievement rate over time, per student, subject, or centre depending on the filters applied. The x-axis shows dates in the selected range and the y-axis shows the achievement percentage.
### Date range options
| Range | Description |
| ------------ | ------------------------------------------ |
| 7 days | Last 7 days of activity |
| 30 days | Last 30 days of activity |
| 60 days | Last 60 days of activity |
| 90 days | Last 90 days of activity |
| Current term | From the start of the active academic term |
### Student trend detail
Open a student from the analytics index or their profile to see:
* An achievement time-series chart with the same 7/30/60/90-day range options
* A highlight for consecutive misses
* A subject-by-subject breakdown for that student
* A comparison of the student's achievement against their centre average
* An intervention notes panel
* A printable Student Progress Report
***
## Subject performance analysis
 ### Filters
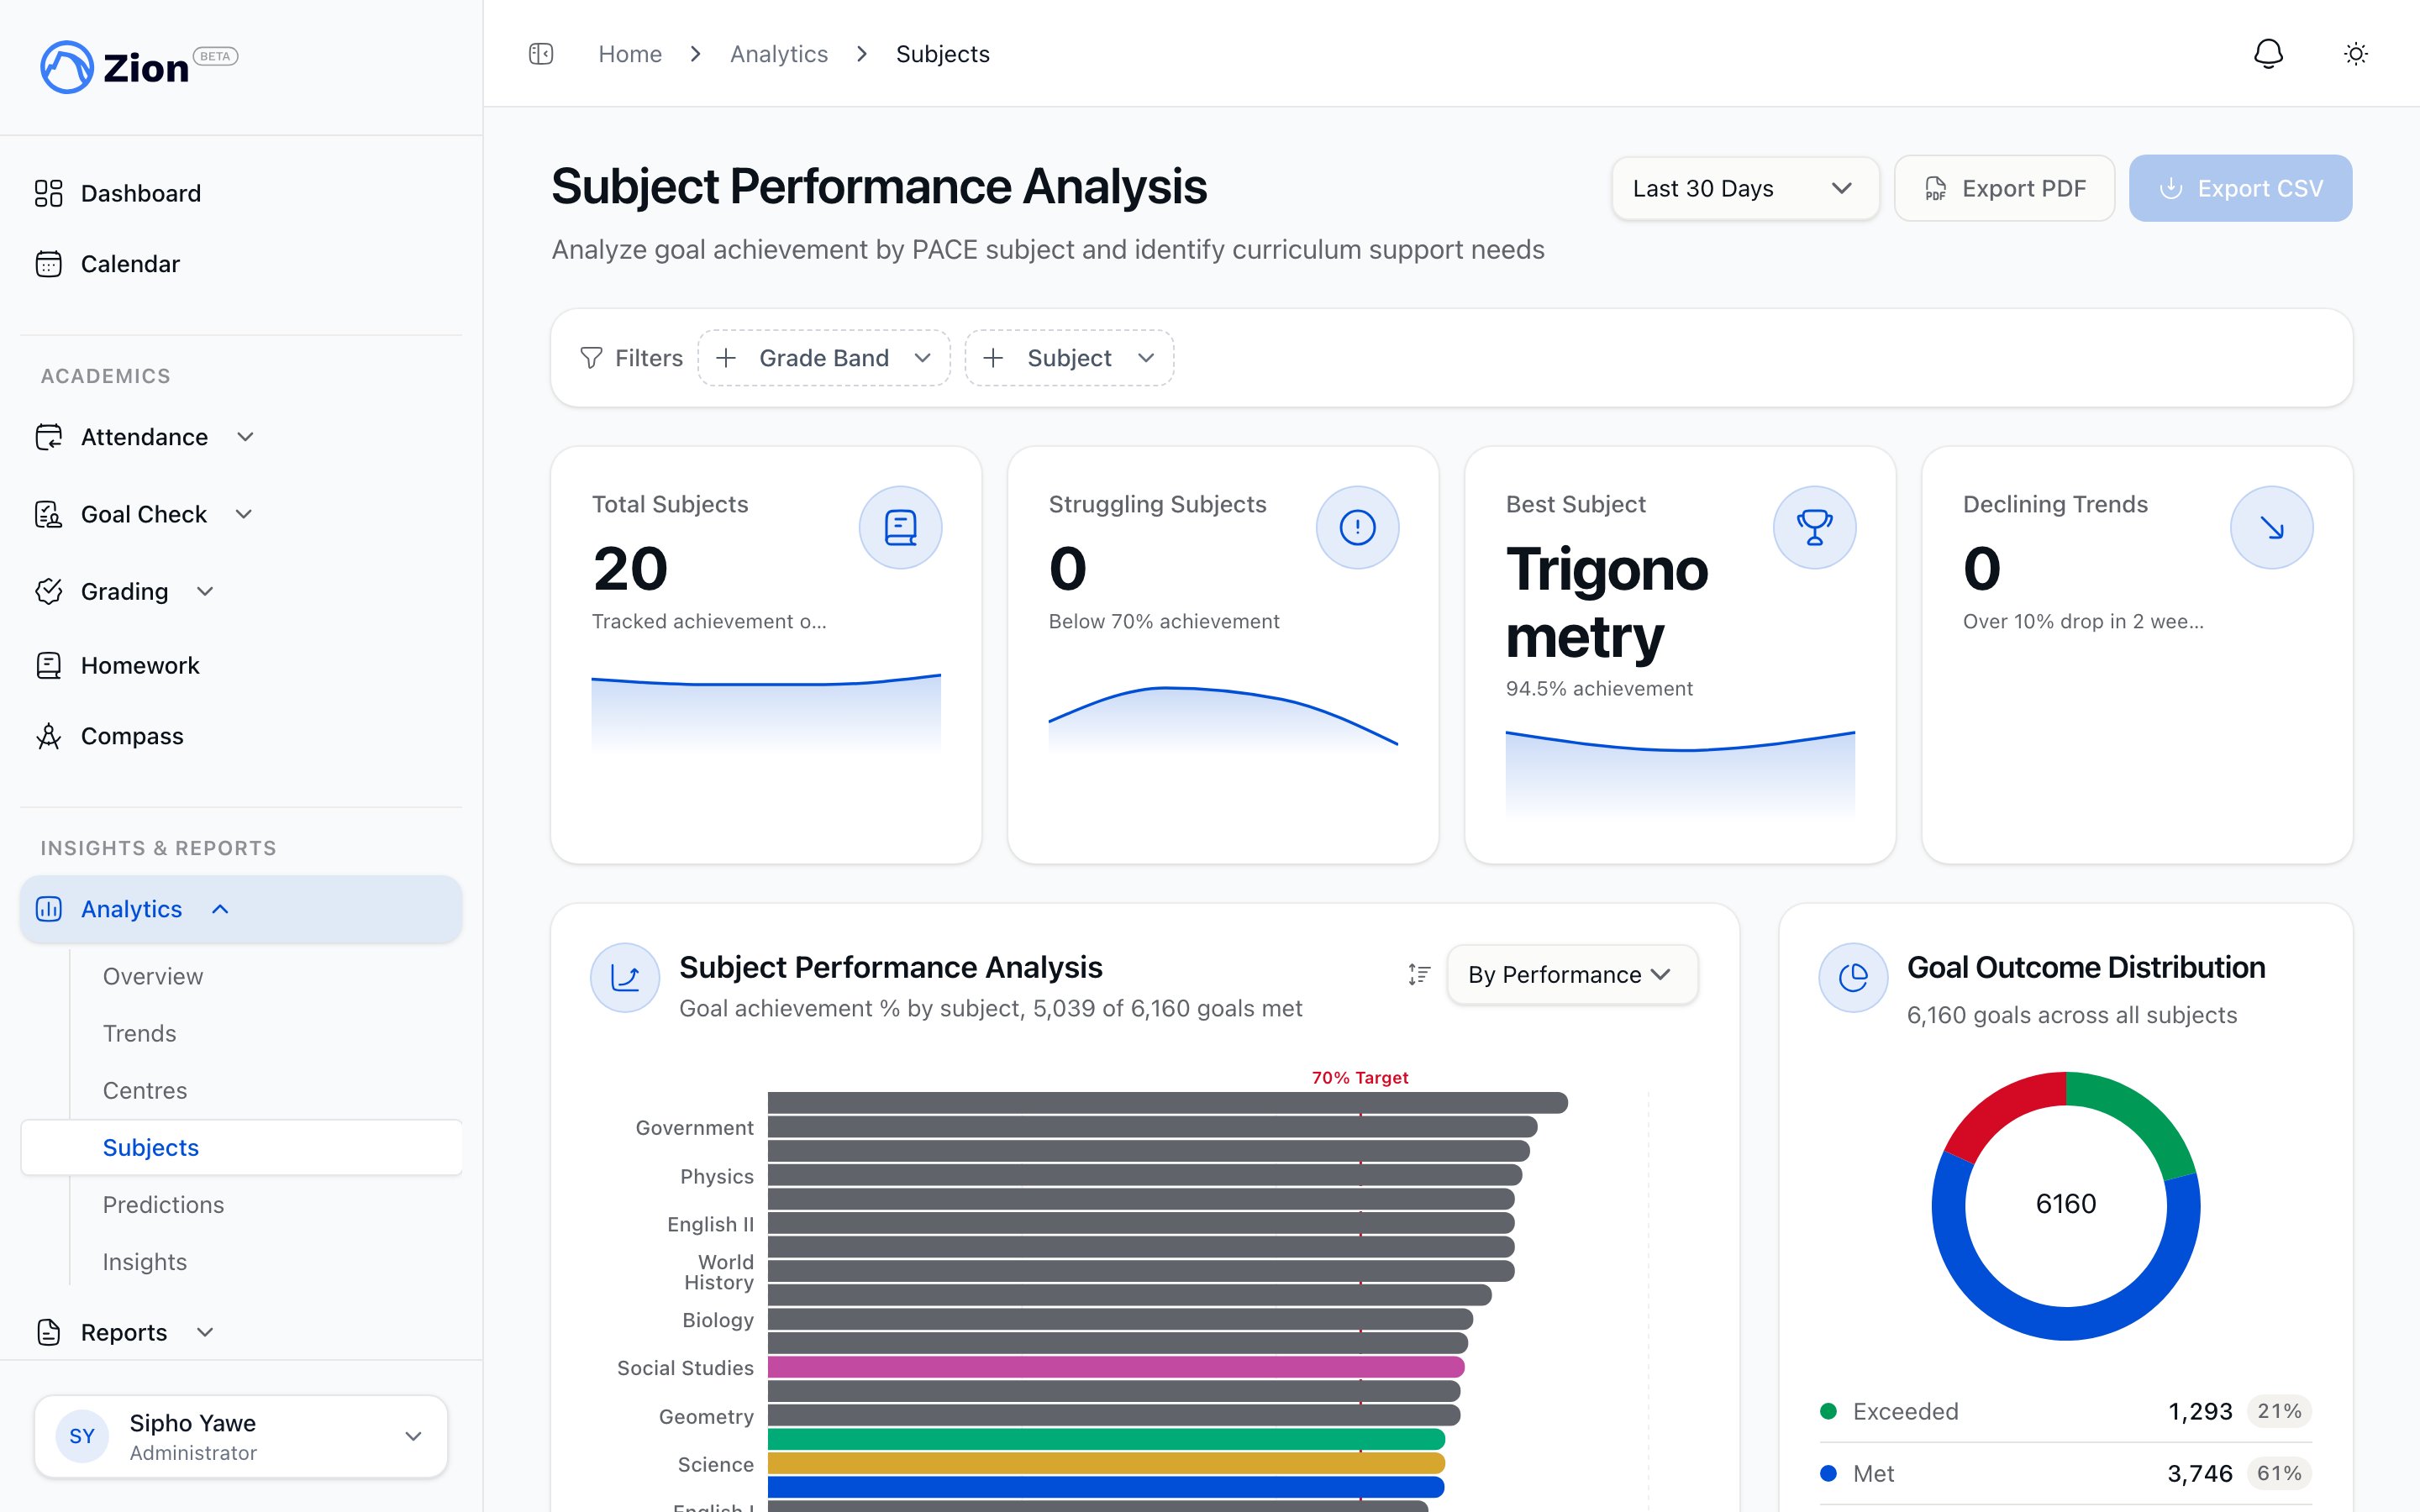
Subject analysis supports a date range (7 days, 30 days, or current term), a grade band (1-4, 5-8, 9-12, or all), and a specific subject filter.
### What you see
* A subject performance chart showing average completion rate, total goals in the period, pass rate, and trend direction per subject
* A grade-band by subject matrix
* A PACE-level completion-rate table
* A radar overview comparing relative performance across all subjects at once, useful for spotting outliers
Clicking a subject opens its student breakdown, PACE-level performance, and historical trend, compared against the school average.
### Exporting
Export the subject report as a CSV, or generate a PDF report from the export control on the subjects page.
***
## Centre comparison
### What you see
* Summary statistics: mean achievement, standard deviation, and total student count across centres
* A comparison chart across all learning centres
* A top-5 and bottom-5 trend chart
* A sortable metrics table
### Centre metrics table
| Column | Description |
| --------------- | ----------------------------- |
| Centre name | Learning centre identifier |
| Students | Active student count |
| Completion rate | Average goal-achievement rate |
| Goals this week | Total goals set |
| Trend | Direction indicator |
### Outlier highlighting
Centres more than one standard deviation above the mean are flagged as high performers. Centres more than one standard deviation below the mean are flagged as needing attention. Ongoing low performance is tracked through a first-class centre\_low\_performance alert rather than a temporary banner. See [Alerts](/features/alerts/overview).
### Exporting
Export the centre comparison table as a CSV from the centres page.
***
## Reading the data
| Question | Where to look |
| -------------------------------------- | ----------------------------------------------------- |
| Which days had the lowest achievement? | Trends time-series chart |
| Which centres need support? | Centre comparison table and outlier highlighting |
| Which subjects are struggling? | Subject performance chart and radar overview |
| Is a specific student falling behind? | Student trend detail and consecutive-misses highlight |
Viewing Trends, Subjects, and Centres does not require an active subscription. Exporting a CSV or PDF, adding an intervention note, and everything on the Pattern Insights page does.
***
## Related pages
How AI-generated pattern insights are detected and reviewed
Termly goal projections and on-track, at-risk, off-track status
Attendance-specific trend analysis
How centre-scoped analytics appear for supervisors
### Filters
Subject analysis supports a date range (7 days, 30 days, or current term), a grade band (1-4, 5-8, 9-12, or all), and a specific subject filter.
### What you see
* A subject performance chart showing average completion rate, total goals in the period, pass rate, and trend direction per subject
* A grade-band by subject matrix
* A PACE-level completion-rate table
* A radar overview comparing relative performance across all subjects at once, useful for spotting outliers
Clicking a subject opens its student breakdown, PACE-level performance, and historical trend, compared against the school average.
### Exporting
Export the subject report as a CSV, or generate a PDF report from the export control on the subjects page.
***
## Centre comparison
### What you see
* Summary statistics: mean achievement, standard deviation, and total student count across centres
* A comparison chart across all learning centres
* A top-5 and bottom-5 trend chart
* A sortable metrics table
### Centre metrics table
| Column | Description |
| --------------- | ----------------------------- |
| Centre name | Learning centre identifier |
| Students | Active student count |
| Completion rate | Average goal-achievement rate |
| Goals this week | Total goals set |
| Trend | Direction indicator |
### Outlier highlighting
Centres more than one standard deviation above the mean are flagged as high performers. Centres more than one standard deviation below the mean are flagged as needing attention. Ongoing low performance is tracked through a first-class centre\_low\_performance alert rather than a temporary banner. See [Alerts](/features/alerts/overview).
### Exporting
Export the centre comparison table as a CSV from the centres page.
***
## Reading the data
| Question | Where to look |
| -------------------------------------- | ----------------------------------------------------- |
| Which days had the lowest achievement? | Trends time-series chart |
| Which centres need support? | Centre comparison table and outlier highlighting |
| Which subjects are struggling? | Subject performance chart and radar overview |
| Is a specific student falling behind? | Student trend detail and consecutive-misses highlight |
Viewing Trends, Subjects, and Centres does not require an active subscription. Exporting a CSV or PDF, adding an intervention note, and everything on the Pattern Insights page does.
***
## Related pages
How AI-generated pattern insights are detected and reviewed
Termly goal projections and on-track, at-risk, off-track status
Attendance-specific trend analysis
How centre-scoped analytics appear for supervisors