> ## Documentation Index
> Fetch the complete documentation index at: https://docs.zionapp.co/llms.txt
> Use this file to discover all available pages before exploring further.
# Analytics and Insights Overview
> How Zion's analytics suite surfaces trends, breakdowns, predictions, and detected patterns for administrators and supervisors
Zion's analytics suite turns daily goal, subject, and centre data into four linked surfaces: Trends, Subject and Centre breakdowns, Predictions, and Pattern Insights. Administrators and supervisors use it to spot problems early and decide where to intervene.
 ## The four surfaces
Goal-achievement time series per student, subject, or centre, over 7, 30, 60, or 90 days or the current term.
Subject performance tables and a grade-band by subject matrix, plus centre comparison stats with outlier highlighting.
Per-student, per-subject projections of whether a student will hit their termly PACE-count goal, with an on-track, at-risk, or off-track status.
Statistically detected patterns across day-of-week variance, subject correlation, centre performance, seasonal trend, student velocity, and subject difficulty.
## Who sees what
| Surface | Administrator | Supervisor |
| ----------------------------- | ------------- | ----------------------------- |
| Trends | Org-wide | Their assigned centre(s) only |
| Subject and Centre Breakdowns | Org-wide | Their assigned centre(s) only |
| Predictions | Org-wide | Their assigned centre(s) only |
| Pattern Insights | Yes | No |
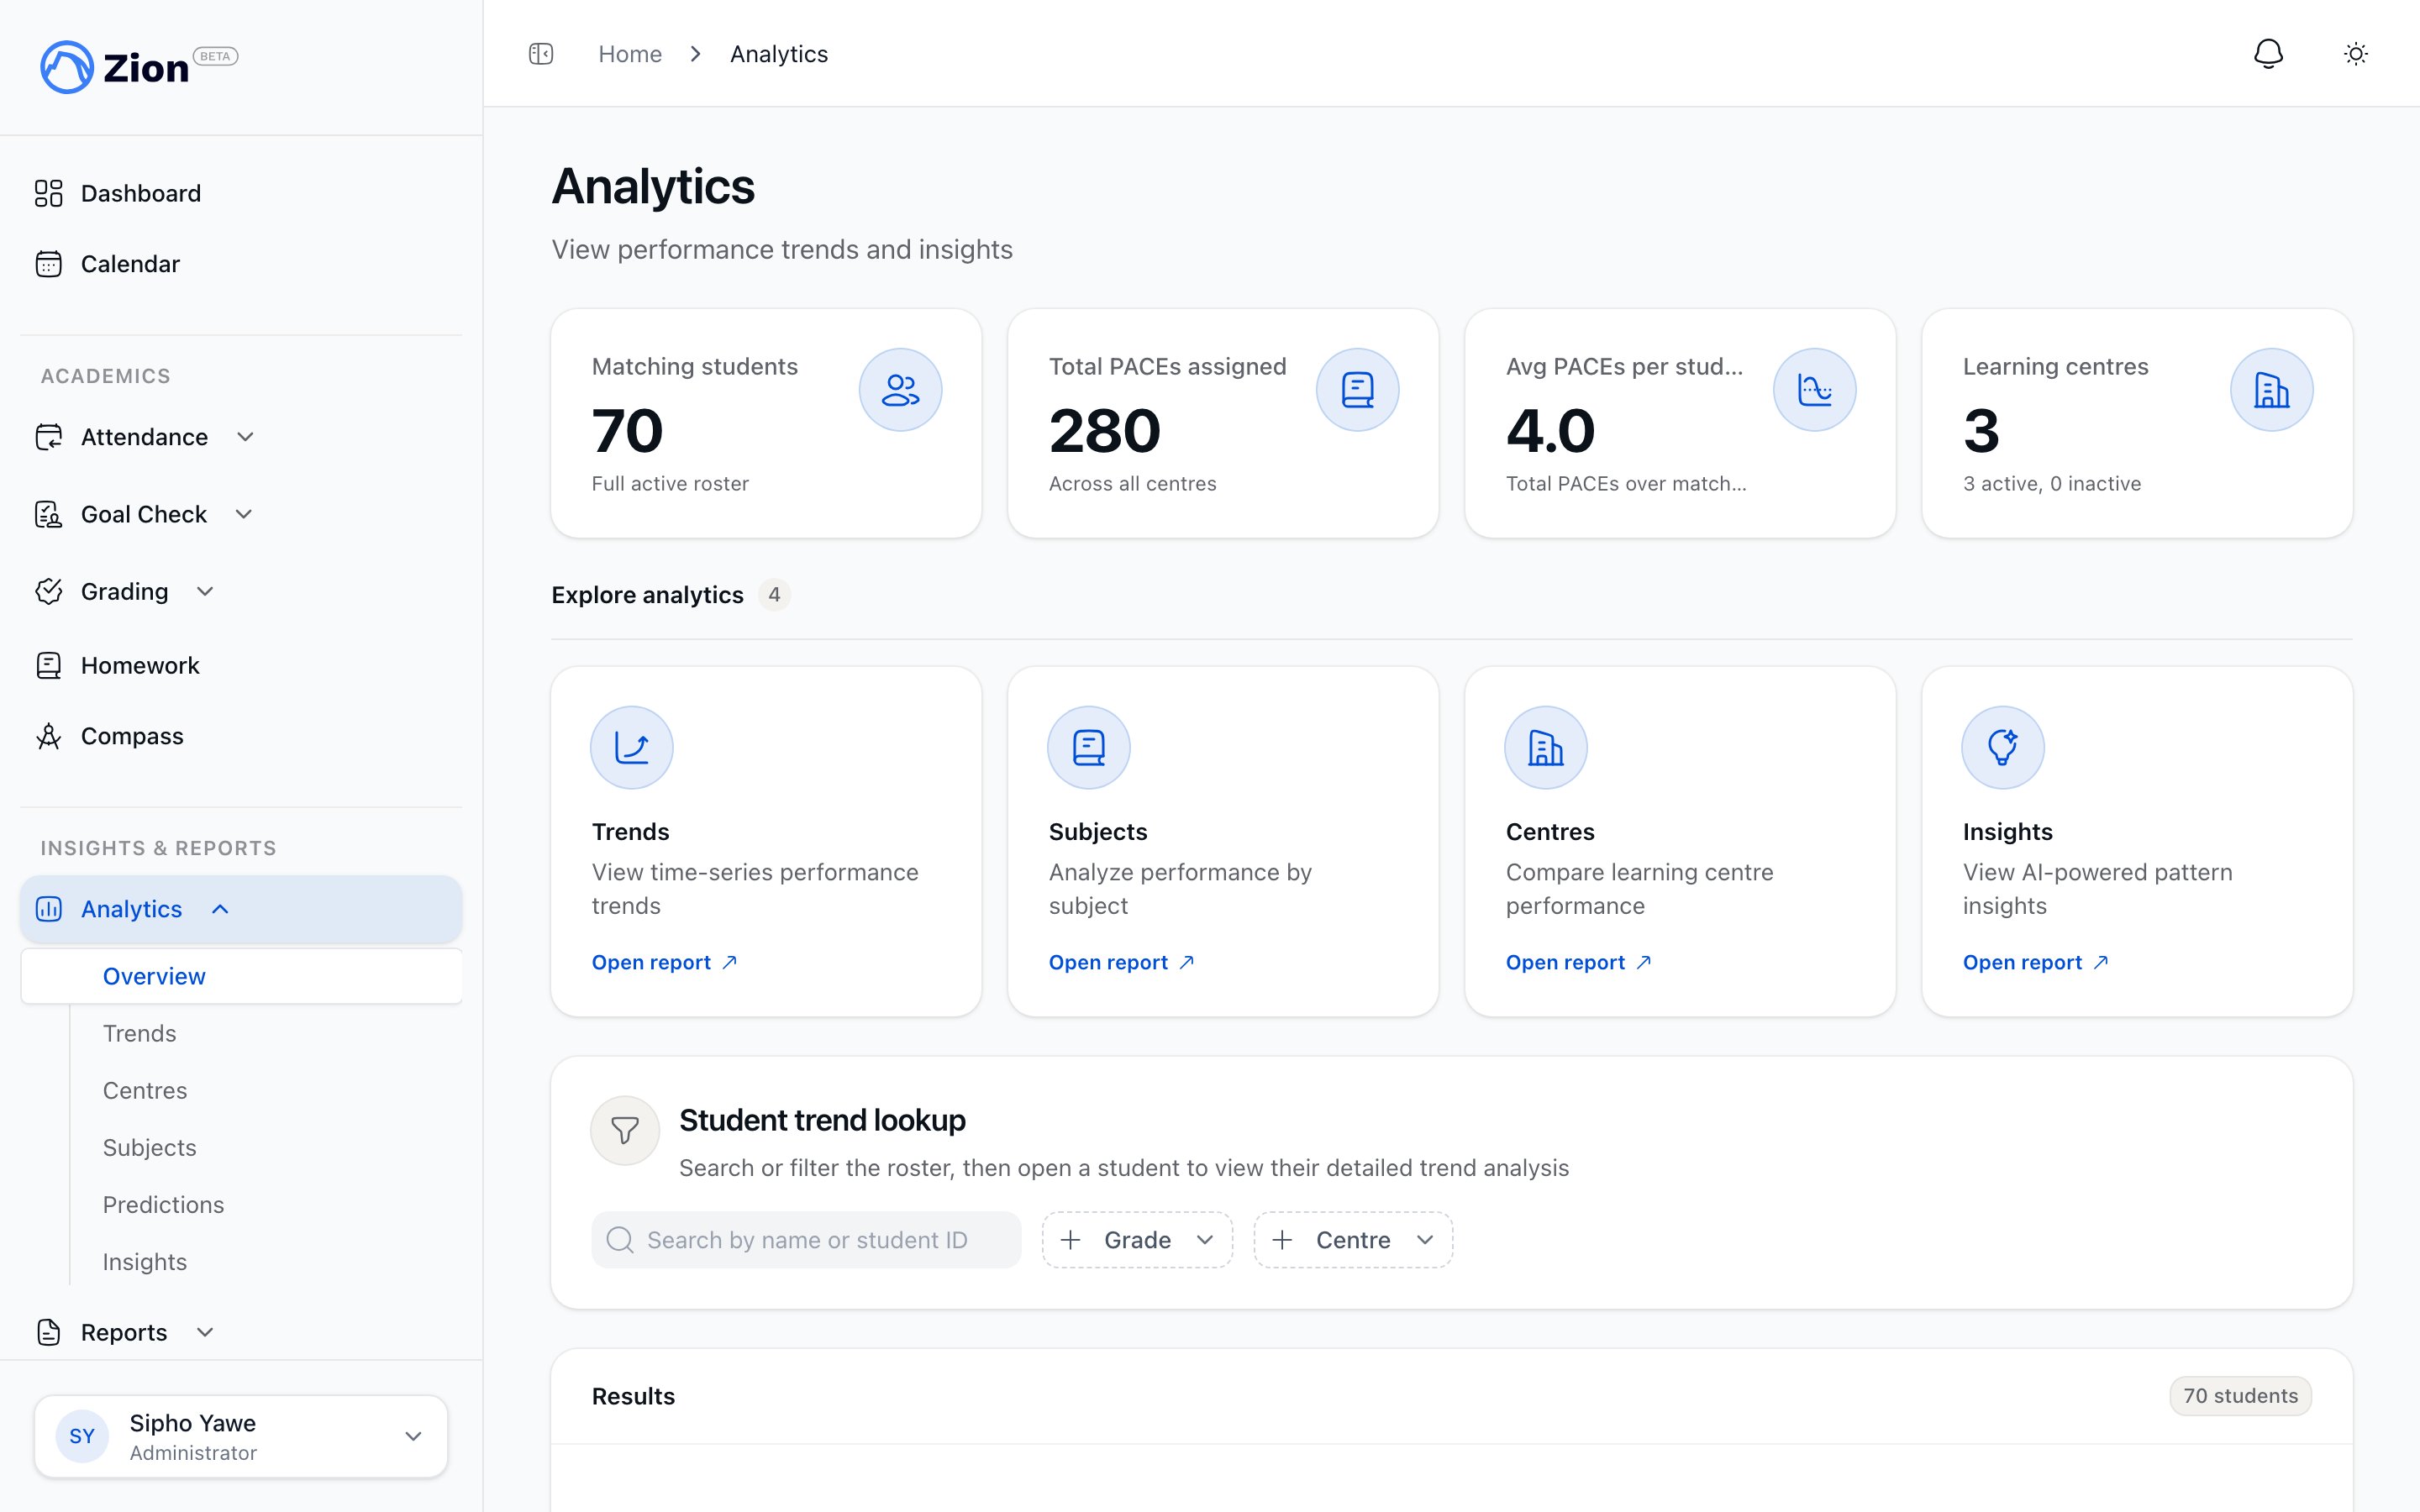
Administrators reach these from **Analytics** in the sidebar, which lands on an index page with quick-link cards into Trends, Subjects, Centres, Insights, and Predictions, plus a student picker for drilling into an individual student's trend detail.
Supervisors reach Trends and Predictions from their own **Analytics** menu. Zion only ever shows them the centre or centres they are assigned to, no matter what they try, so a supervisor never sees another centre's figures. A supervisor with no assigned centre sees empty data rather than org-wide totals.
Pattern Insights is administrator-only. Supervisors do not have a menu entry for it, and Zion blocks a supervisor from opening it any other way too.
## Where the numbers come from
All four surfaces read from the same goal-check data and share one authorization layer, so a number never differs depending on which screen you view it from. Predictions use the same projection calculation that powers the parent and student "My Progress" view, so a parent checking their child's trajectory sees the same figures a supervisor sees for that student.
## Exporting
Most surfaces support export for offline review or reporting:
| Surface | Export |
| -------------------- | ------------------------------------- |
| Subject Breakdown | CSV and PDF |
| Centre Breakdown | CSV |
| Predictions | CSV of at-risk and off-track students |
| Pattern Insights | PDF, full report or a single insight |
| Student trend detail | Printable student progress report |
## Building history
New schools see limited insights and thin trend lines at first. Pattern Insights in particular need weeks of goal data before the detectors have enough samples to reach high confidence. Reliability grows as more terms of data accumulate.
## Related pages
How to read the trend charts, subject matrix, and centre comparison, and how to export them.
How on-track, at-risk, and off-track status is decided, and how to export at-risk students.
The six detected pattern types, confidence levels, and how to act on an insight.
Turning insights and predictions into interventions.
## The four surfaces
Goal-achievement time series per student, subject, or centre, over 7, 30, 60, or 90 days or the current term.
Subject performance tables and a grade-band by subject matrix, plus centre comparison stats with outlier highlighting.
Per-student, per-subject projections of whether a student will hit their termly PACE-count goal, with an on-track, at-risk, or off-track status.
Statistically detected patterns across day-of-week variance, subject correlation, centre performance, seasonal trend, student velocity, and subject difficulty.
## Who sees what
| Surface | Administrator | Supervisor |
| ----------------------------- | ------------- | ----------------------------- |
| Trends | Org-wide | Their assigned centre(s) only |
| Subject and Centre Breakdowns | Org-wide | Their assigned centre(s) only |
| Predictions | Org-wide | Their assigned centre(s) only |
| Pattern Insights | Yes | No |
Administrators reach these from **Analytics** in the sidebar, which lands on an index page with quick-link cards into Trends, Subjects, Centres, Insights, and Predictions, plus a student picker for drilling into an individual student's trend detail.
Supervisors reach Trends and Predictions from their own **Analytics** menu. Zion only ever shows them the centre or centres they are assigned to, no matter what they try, so a supervisor never sees another centre's figures. A supervisor with no assigned centre sees empty data rather than org-wide totals.
Pattern Insights is administrator-only. Supervisors do not have a menu entry for it, and Zion blocks a supervisor from opening it any other way too.
## Where the numbers come from
All four surfaces read from the same goal-check data and share one authorization layer, so a number never differs depending on which screen you view it from. Predictions use the same projection calculation that powers the parent and student "My Progress" view, so a parent checking their child's trajectory sees the same figures a supervisor sees for that student.
## Exporting
Most surfaces support export for offline review or reporting:
| Surface | Export |
| -------------------- | ------------------------------------- |
| Subject Breakdown | CSV and PDF |
| Centre Breakdown | CSV |
| Predictions | CSV of at-risk and off-track students |
| Pattern Insights | PDF, full report or a single insight |
| Student trend detail | Printable student progress report |
## Building history
New schools see limited insights and thin trend lines at first. Pattern Insights in particular need weeks of goal data before the detectors have enough samples to reach high confidence. Reliability grows as more terms of data accumulate.
## Related pages
How to read the trend charts, subject matrix, and centre comparison, and how to export them.
How on-track, at-risk, and off-track status is decided, and how to export at-risk students.
The six detected pattern types, confidence levels, and how to act on an insight.
Turning insights and predictions into interventions.