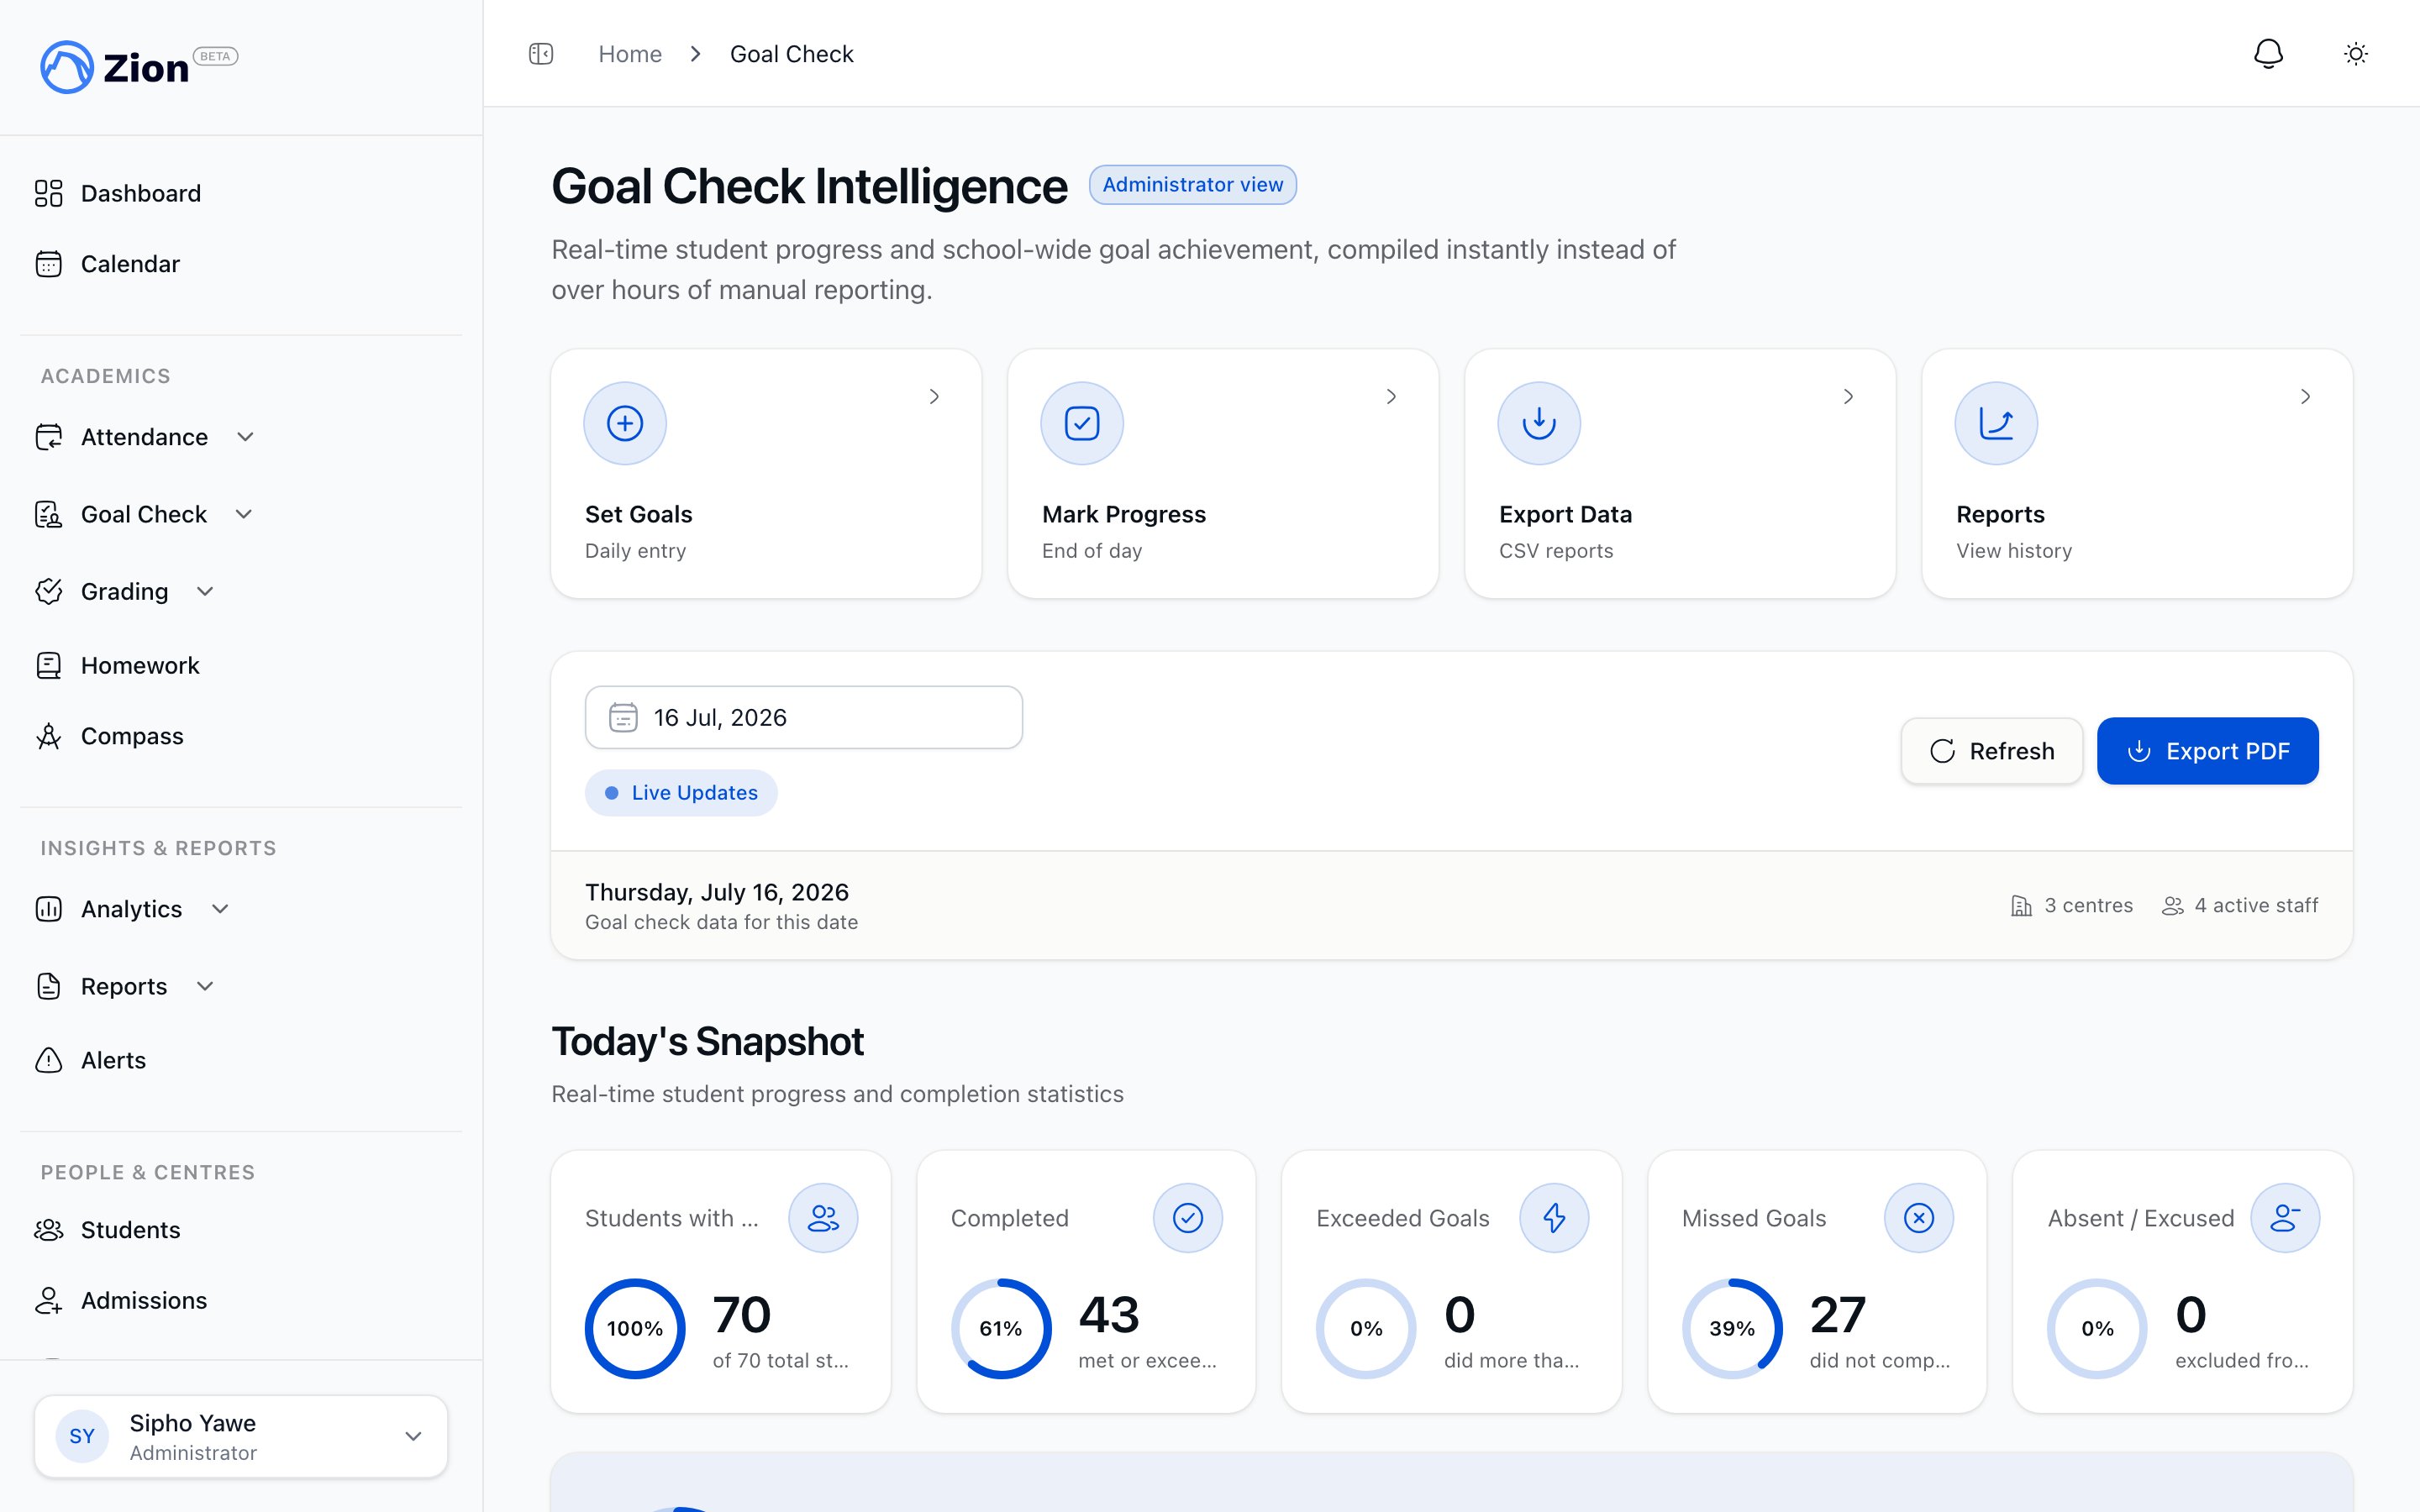
A Goal Check snapshot included in the whole-school reporting view.
Generating a report
1
Open Weekly School Goal Check Report
In the sidebar, open Reports, then select Weekly Reports.
2
Choose a week
Use the Current Week or Previous Week buttons, or pick a custom date range with the date range picker.
3
Click Generate Report
The button is disabled until a week is selected. If your role does not have permission to generate reports, the button stays visible but does nothing.
4
Wait for generation
Generation can take up to a minute for a large school. The page shows a Generating Report status while it runs.
5
Download the files
On success you get a Download PDF Report link and a Download CSV Data link. Both are also saved to report history.
Generating a report for a week that already has a completed report for your organization returns the existing report instead of creating a duplicate.
Automatic weekly generation
Weekly reports do not require an administrator to generate them by hand. Each organization has a weekly report schedule, controlled by a per-org setting:
A scheduled job checks every organization each hour. Once an organization reaches its configured day and hour, it generates that week’s report (Monday through Sunday, current week) if one does not already exist, then emails the PDF to the configured recipient list. If no recipients are saved, the report goes to every active administrator in the organization. Saved recipients can include people without a Zion account. Their addresses receive the report by email; addresses that match an active staff account are also notified in-app.
Because generation is keyed to one report per organization per week, the automatic run and a manual run on the same week never produce duplicates. Whichever happens first stands.
What the report contains
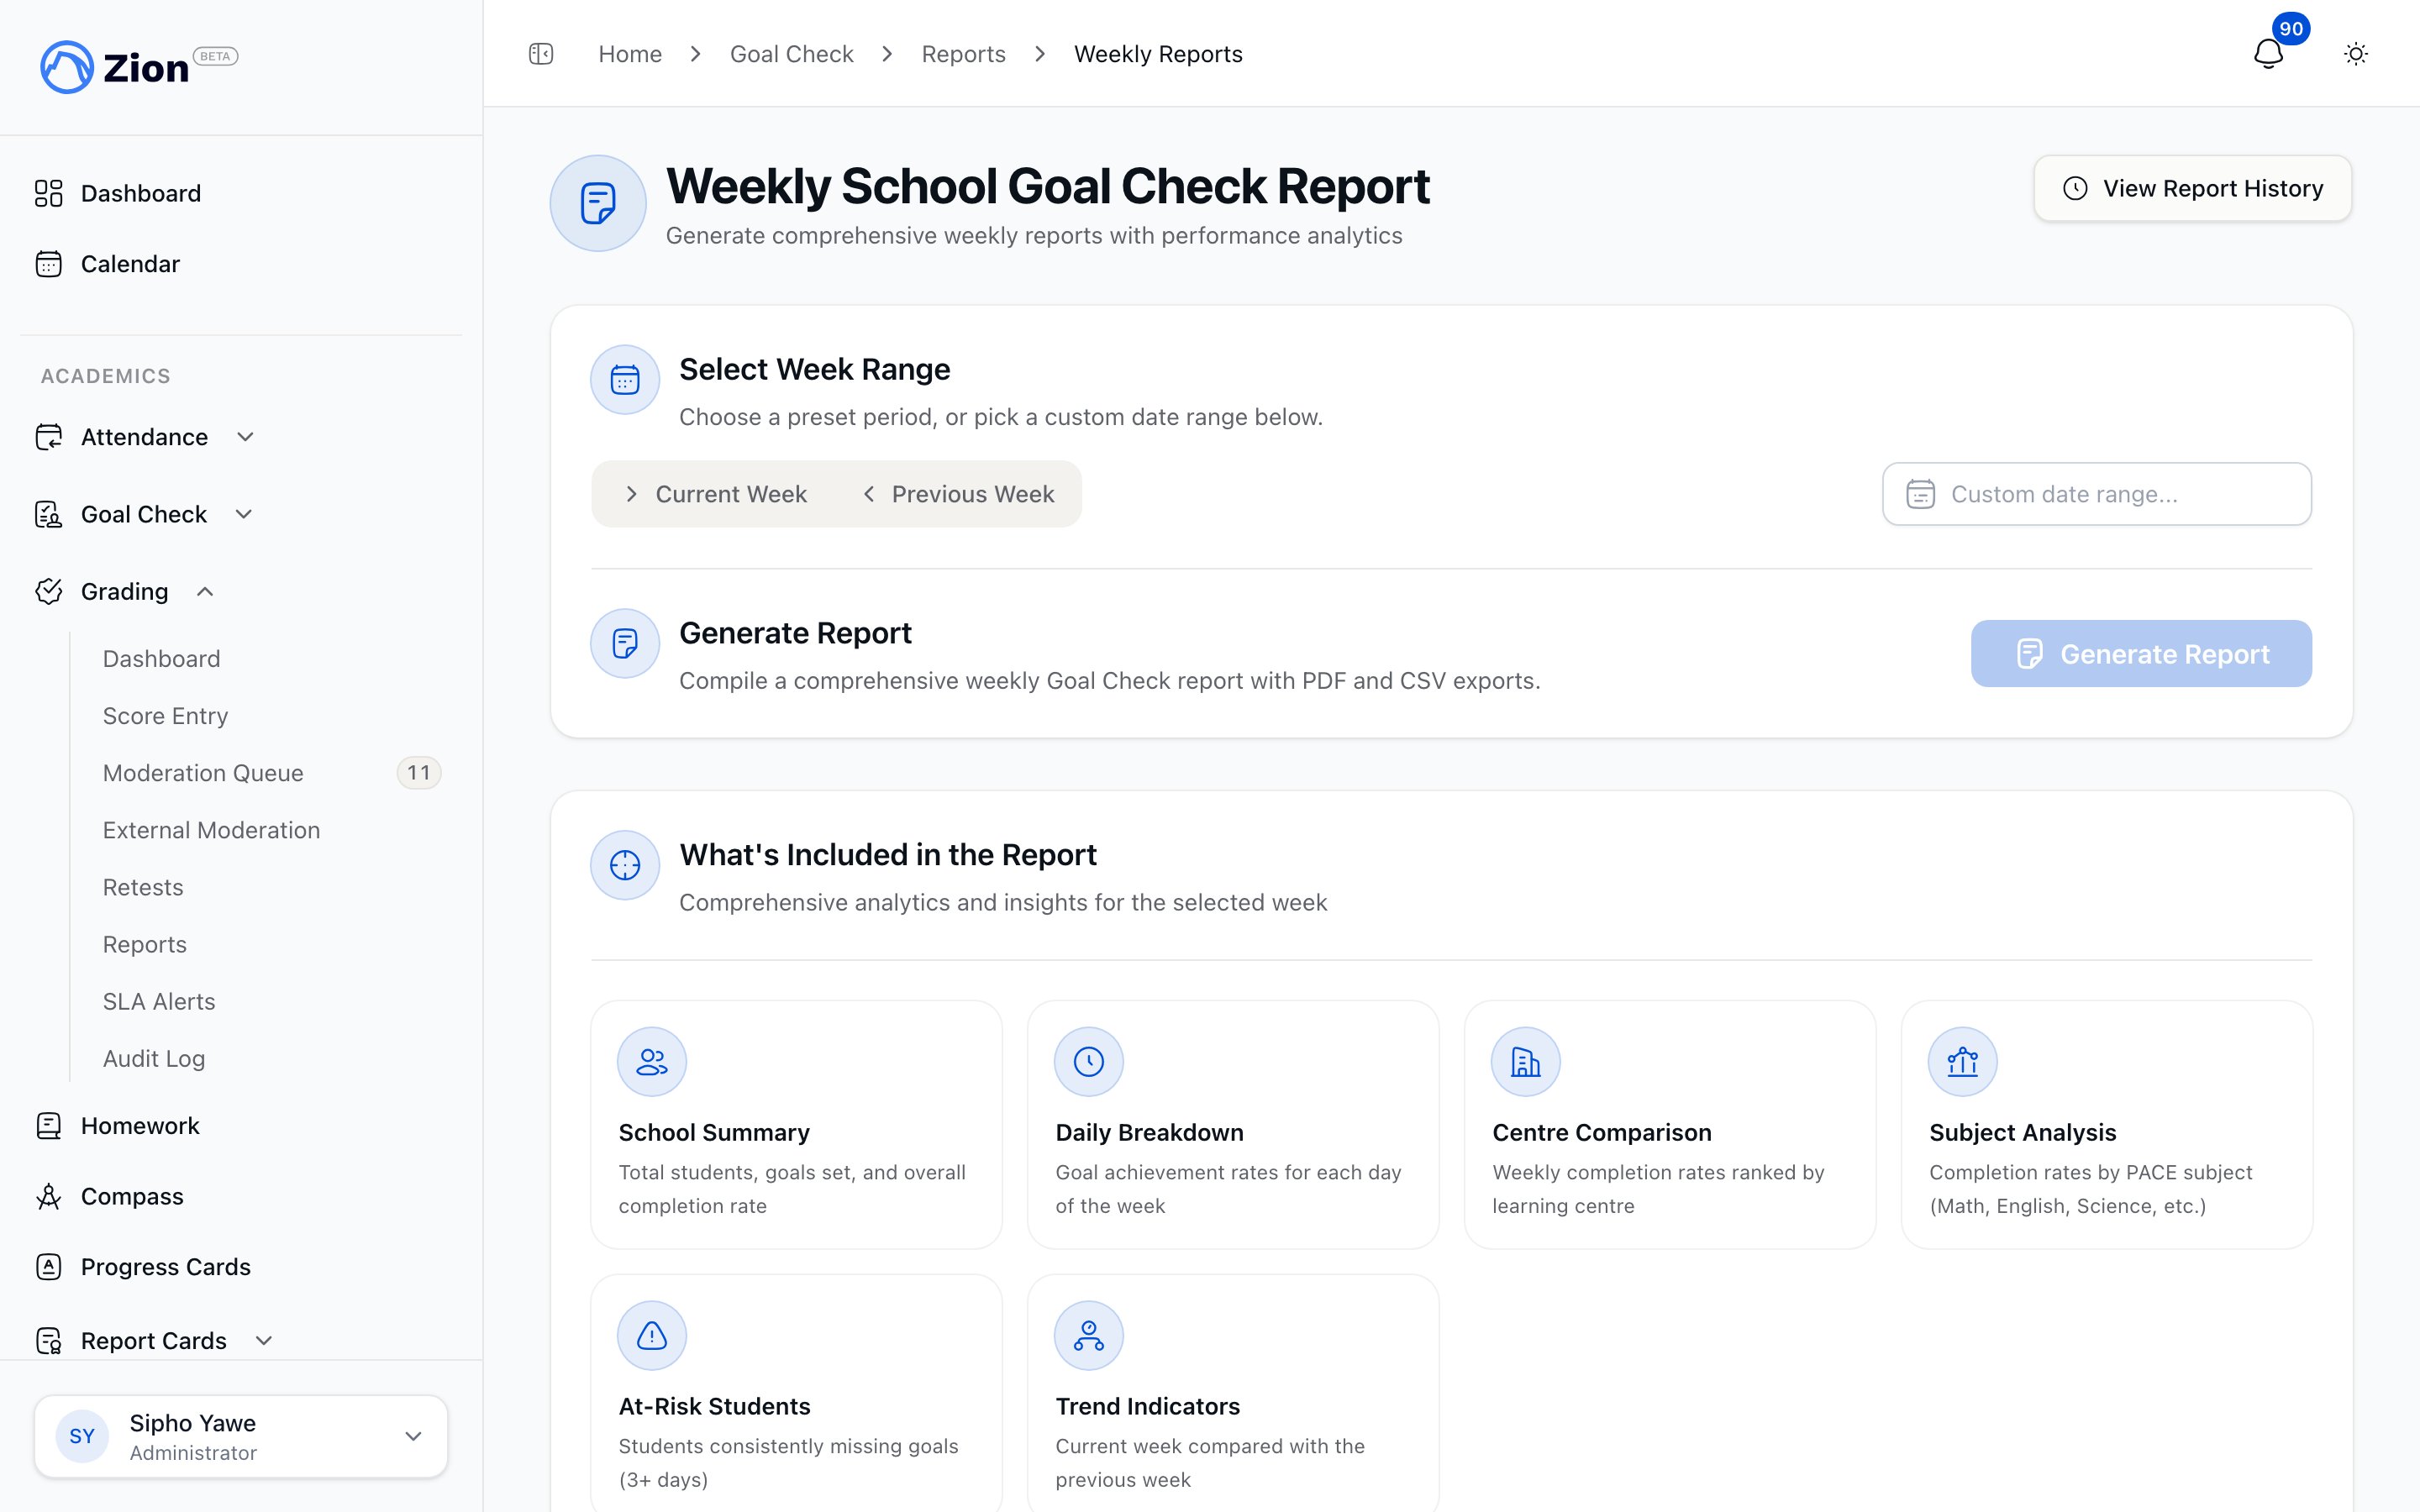
The weekly report view, showing the week's completion alongside the centre and subject breakdowns.
A day marked Absent, Excused, or Doing non-PACE work is never counted as a missed goal in these numbers. It is left out of the completion-rate calculation entirely, so an honest absence never drags a student’s or a centre’s rate down.
Report history
Weekly History, under Reports in the sidebar, lists every weekly report generated for your organization, most recent first. Each row shows:- Week range
- Status: Completed, Generating, or Failed
- Overall completion rate
- Total students and total goals set
- Generated date and time
- Actions: download PDF, download CSV, and email the report to additional recipients
Related features
Data export
Export raw Goal Check data for custom analysis outside of the weekly report.
Goal Check overview
How goal setting and progress marking feed everything in this report.
The daily routine
The guided Morning Routine and End of Day flow that produces the goals and results this report summarizes.
Administrator: Goal Check
A role-based walkthrough of Goal Check for administrators.