The reporting landscape
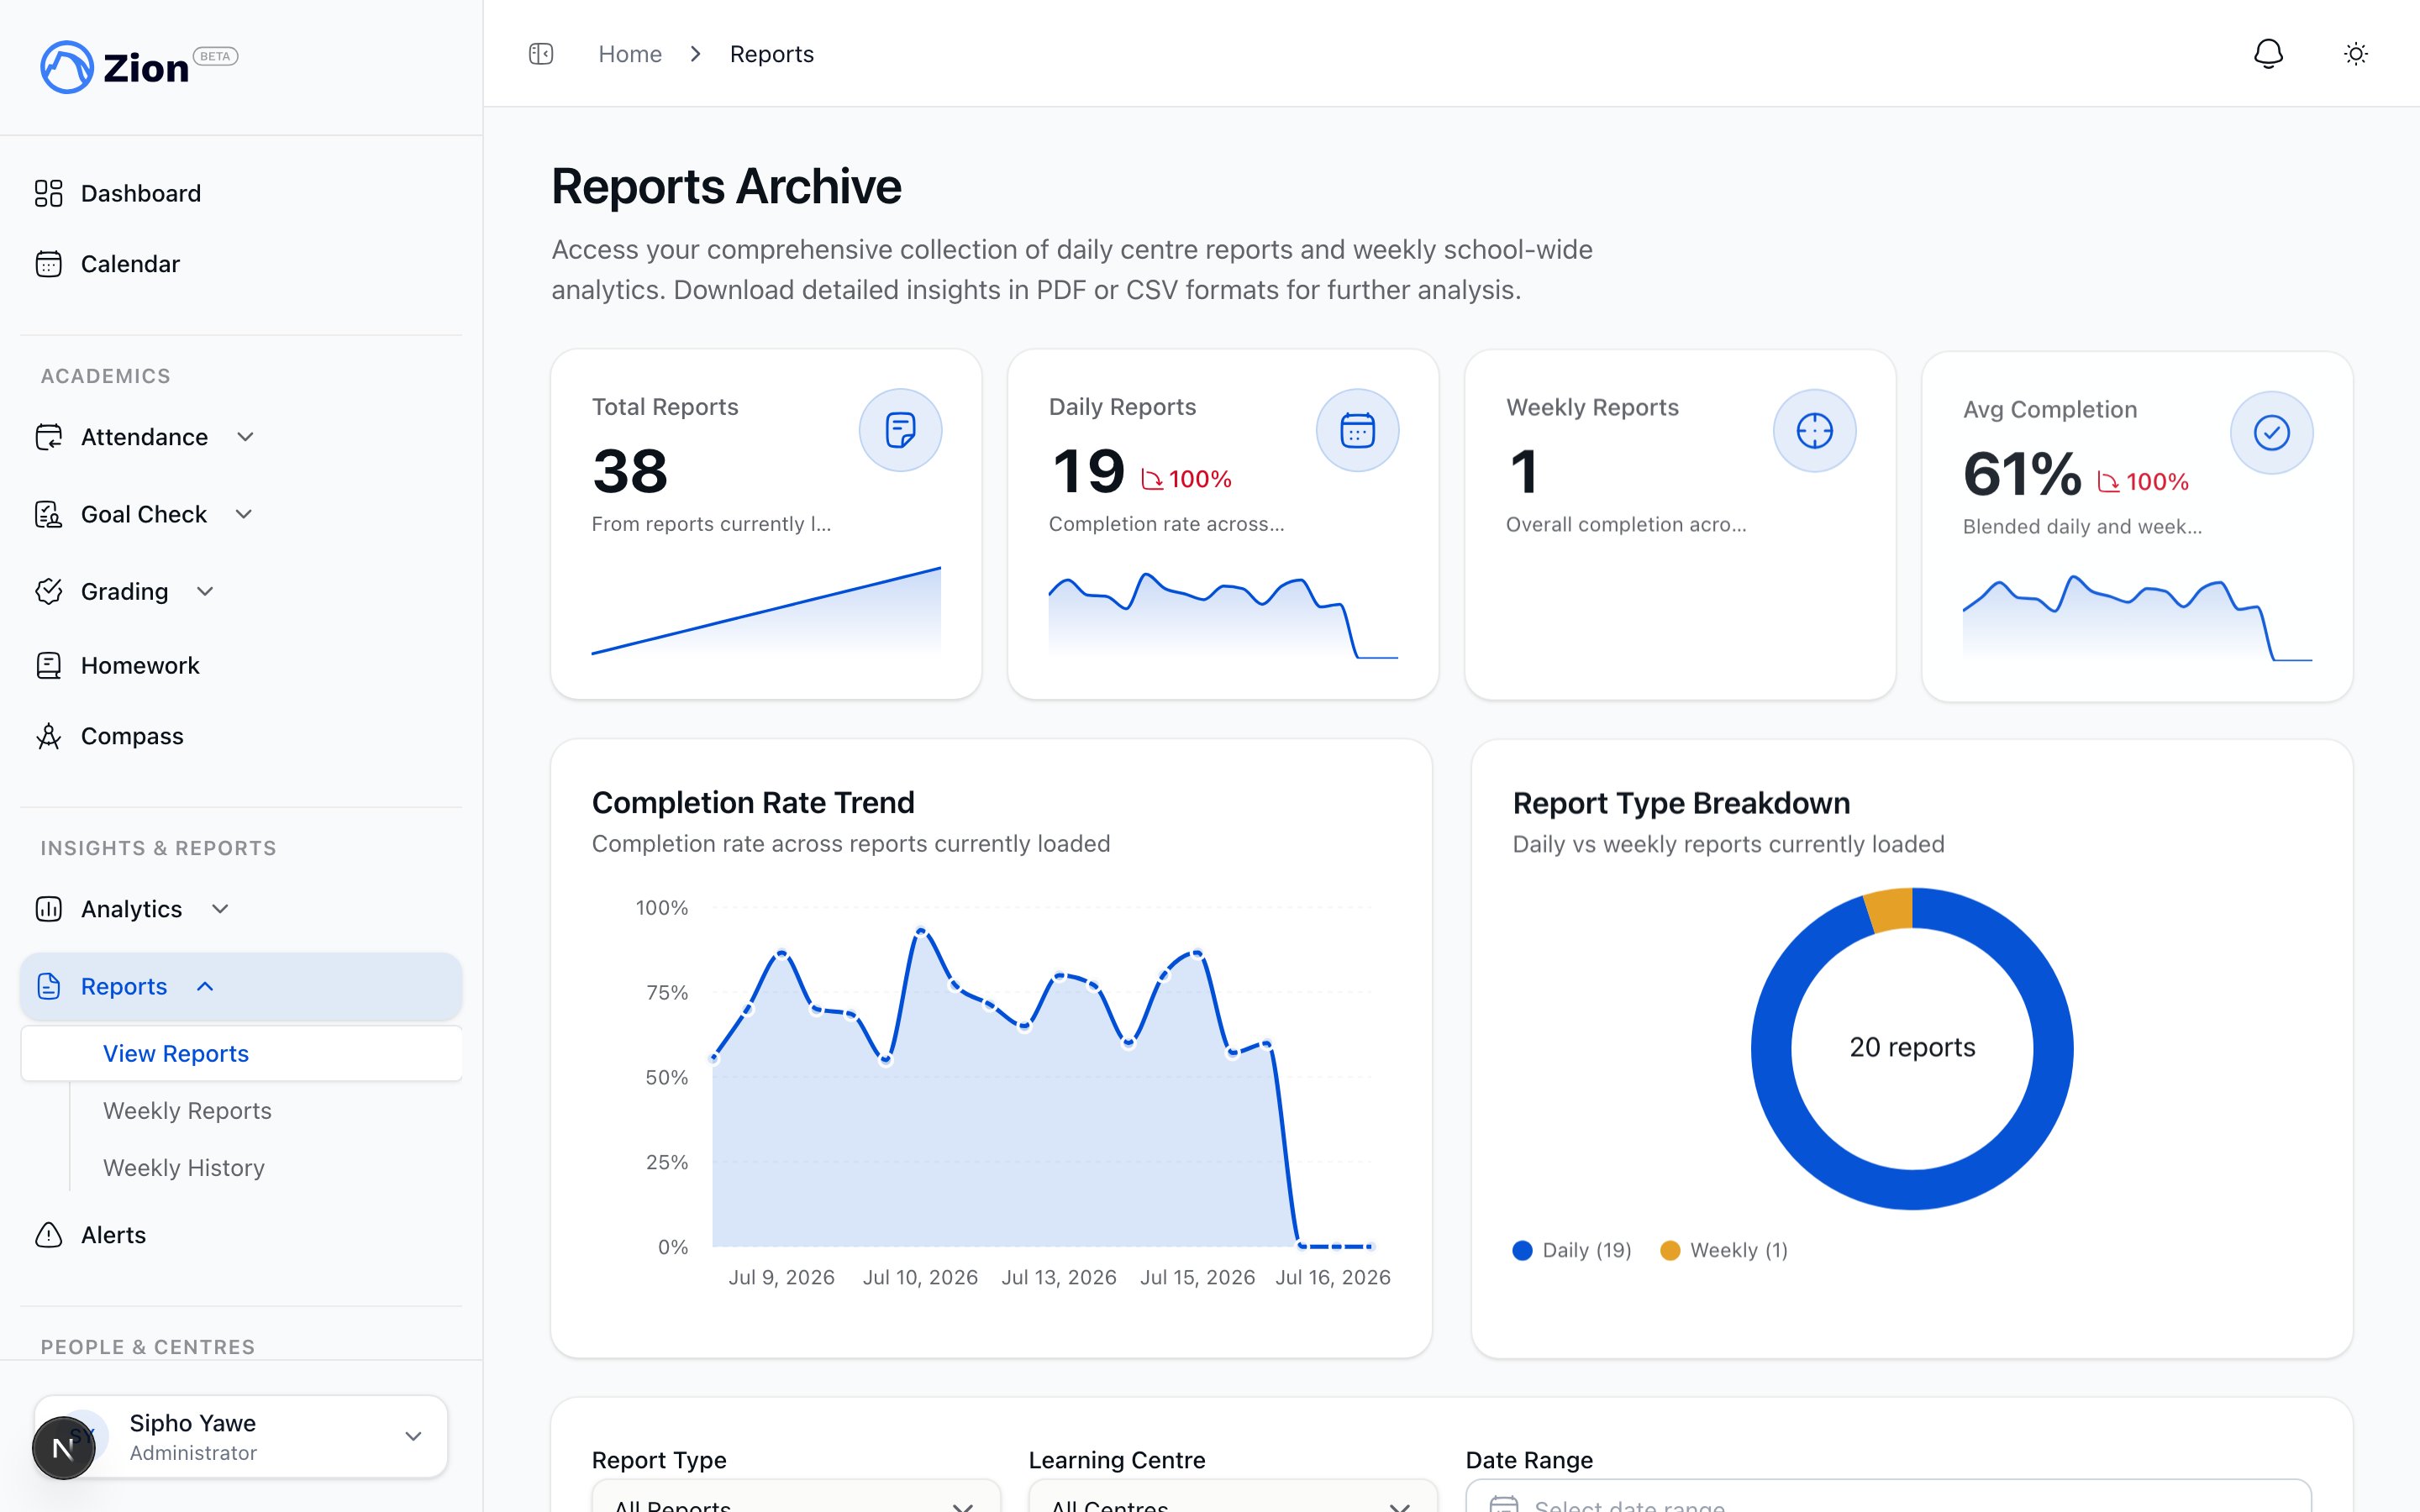
The reports index listing report types available across the school
Every report on this page comes out the same way: a branded PDF with its charts and tables drawn directly into the document, not a plain spreadsheet-style export. Where a CSV is also useful for a spreadsheet or another system, it stays available alongside the PDF.
Goal Check reports
Goal Check has two report types. Daily centre reports cover one learning centre for one day and can be generated once every student in that centre is marked, shown by a readiness indicator such as “Ready (25/25 students marked)”. Weekly school reports cover the whole school for a Monday-to-Friday week and need at least three days of data in the active term.1
Open Reports
From the sidebar, open Reports and choose Daily Centre Report or Weekly School Report.
2
Select scope
Pick a centre and date for a daily report, or a week range and term for a weekly report. Supervisors only see the centres assigned to them.
3
Check readiness
Confirm the readiness indicator before generating. A report generated before all students are marked will understate completion.
4
Generate and export
Generate the report, review it on screen, then download it as PDF or CSV.
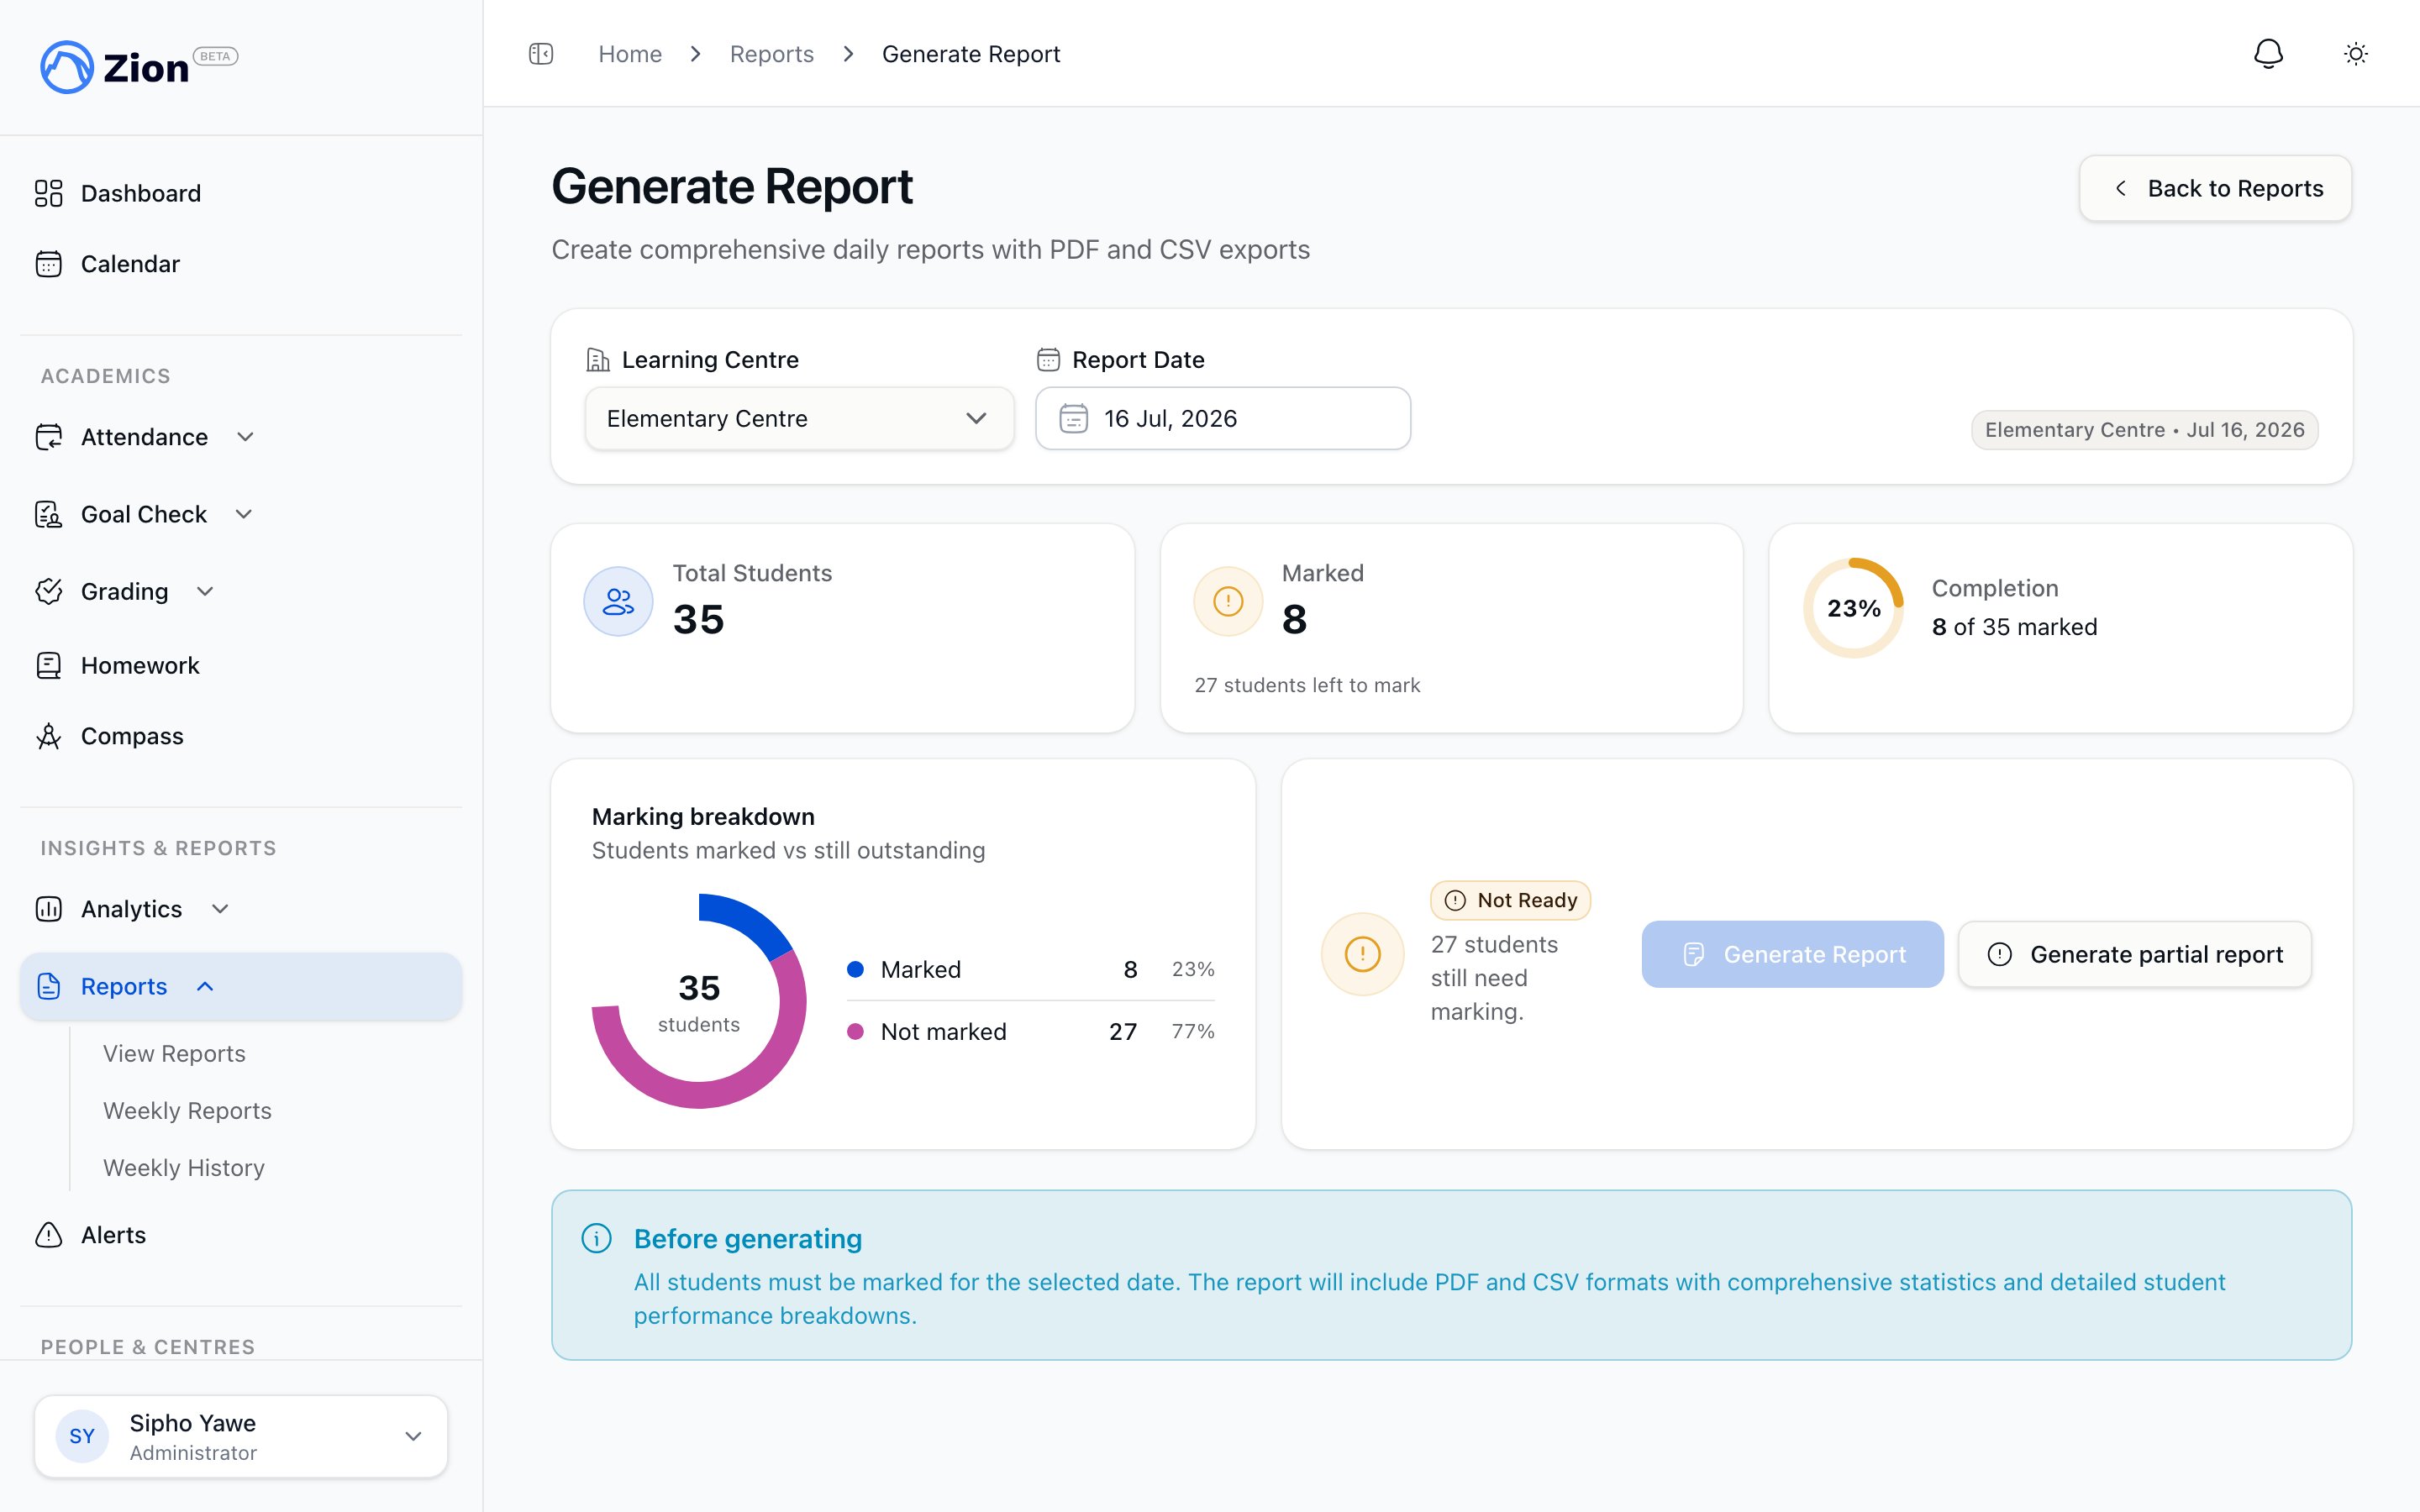
Generating a daily centre report with the readiness indicator showing every student marked
Attendance, grading, homework, and behaviour reports
Each of these features has its own reporting screen, scoped to administrators and, where noted, supervisors or monitors assigned to the relevant centre.Attendance Reports
Report exports by student, class, and centre. This screen is administrator-only; supervisors and monitors use the attendance dashboard and trend views instead.
Grading Audit Trail
A record of every score entry and correction, used to review grading history.
Homework Completion Report
Assignment completion rates by class and student.
Behaviour Reports
Incident summaries by student and centre for behaviour logging.
Report cards
Report cards compile a student’s term data (PACE grades, test scores, attendance, Goal Check completion, and parent-safe character notes) into a PDF. Administrators, supervisors, and monitors can generate report cards for a term, optionally scoped to one centre; supervisors and monitors only ever see their assigned centres, no matter what they select on screen. Before generating, Zion checks term readiness for each student. A student with zero finalized test scores blocks generation until you check an acknowledgement box; finalized scores with none passing, missing attendance, missing Goal Check data, or missing character notes show as non-blocking warnings. Once generation completes, use the distribution panel to download all cards as a ZIP or send them to parents by email. Each send writes a delivery status per parent (sent, queued, bounced, failed, or skipped for students with no linked parent email) and publishes the cards so parents can view them in their own portal. Administrators can also generate an official student transcript from that student’s permanent record. Only one transcript request per student can be in progress at a time, and only administrators can request one.Report Cards Overview
What a report card contains and how term data is compiled.
Generating and Distributing
The full generation, readiness-check, and distribution workflow.
Templates
Customize which sections appear and in what order.
Permanent Record
Multi-year academic history and official transcripts.
Progress Cards
Progress Cards is a different document from the term report card above. Open Progress Cards under Academics in the sidebar, pick a student from the roster, and Zion opens their Supervisor’s Progress Card: a single view of every PACE the student has completed across the whole year, colour-coded by the term they finished it in. Download it as a PDF or send it straight to a parent by email. Administrators, supervisors, and monitors can all open it, scoped to the centres they can already see. Use a report card when you need one term’s grades and attendance. Use a Progress Card when you want the long view of a student’s PACE progress across terms.Analytics and pattern insights
Analytics sits alongside the Goal Check and report-card reports and answers a different question: not what happened on one day or in one term, but what is trending across weeks and terms. Administrators see school-wide data; supervisors see only their assigned centres.- Trends: goal-achievement time series per student, subject, or centre over 7, 30, 60, or 90 days, or the current term.
- Subject and centre breakdowns: comparison tables and charts, each exportable to CSV, with a PDF export for the subject view.
- Predictions: a per-student, per-subject projection of whether a student is on track to hit their termly PACE goal, classified on track, at risk, or off track. The same calculation powers the parent and student “My Progress” view, so families see the same numbers as staff. The at-risk list can be exported to CSV.
- Pattern insights: administrator-only, statistically detected patterns across six categories (day-of-week variation, subject correlation, centre performance, seasonal trend, student velocity, and subject difficulty), each with a confidence level. Insights can be filtered, dismissed, and exported to PDF. Generating and exporting insights requires an active subscription.
Insights Overview
How the analytics suite is organized and who sees what.
Analytics
Trends, subject and centre breakdowns, and their exports.
Insight Types
The six pattern categories and their thresholds.
Predictions
How on-track, at-risk, and off-track status is calculated.
The unified data export
Beyond individual reports, Zion has one export center for raw data. At Settings > Data Export, administrators can request a bundle covering students, attendance, goal checks, grades, and report cards (when enabled), across a chosen date range or all time. The bundle contains a CSV per entity plus a PDF snapshot. Administrators can scope an export to one or more centres or a single student; supervisors are automatically scoped to their own assigned centres and are blocked if they have none. Export jobs move through queued, running, and ready (or failed). A ready export stays downloadable for 7 days, after which the link expires. Emailed links redirect through a secure download page that re-checks your role and access before minting a fresh signed URL, rather than emailing a raw link. A one-click “Export everything” option requests the full history across all entities for administrators. The older, Goal-Check-only export page still exists for a transition period but no longer accepts new requests; it points to the unified exporter and keeps read-only access to its own history.Exporting Your School's Data
Full detail on entities, scoping, job states, and the download window.
Choosing the right report
I need to check today's Goal Check completion for one centre
I need to check today's Goal Check completion for one centre
Generate a Daily Centre Report once the readiness indicator shows every student marked.
I need to compare centres or subjects over the term
I need to compare centres or subjects over the term
Use Analytics > Subjects or Analytics > Centres, or the Weekly School Report for a Monday-to-Friday view.
I need to send families their child's grades for the term
I need to send families their child's grades for the term
Generate report cards for the term, run the readiness check, then distribute by ZIP or email from the distribution panel.
I need raw data for a spreadsheet or an external system
I need raw data for a spreadsheet or an external system
Request a bundle from Settings > Data Export rather than exporting a single report’s CSV.
I need to know which students are falling behind before the term ends
I need to know which students are falling behind before the term ends
Check Analytics > Predictions for on-track, at-risk, and off-track status per student and subject.
I need a student's whole PACE history, not just this term
I need a student's whole PACE history, not just this term
Open Progress Cards, pick the student, and download or email their Supervisor’s Progress Card.
Related resources
Goal Check Oversight
Use Goal Check reports to inform daily and weekly oversight.
Attendance Guide
Attendance tracking and its reports in context.
Grading Guide
Grading workflows that feed report cards and the audit trail.
Insights Guide
Administrator workflow for analytics and pattern insights.
Goal Check Export
Legacy Goal-Check-only export and its history.
Terminology
Definitions for report and export terms used across Zion.