

Where to find analytics
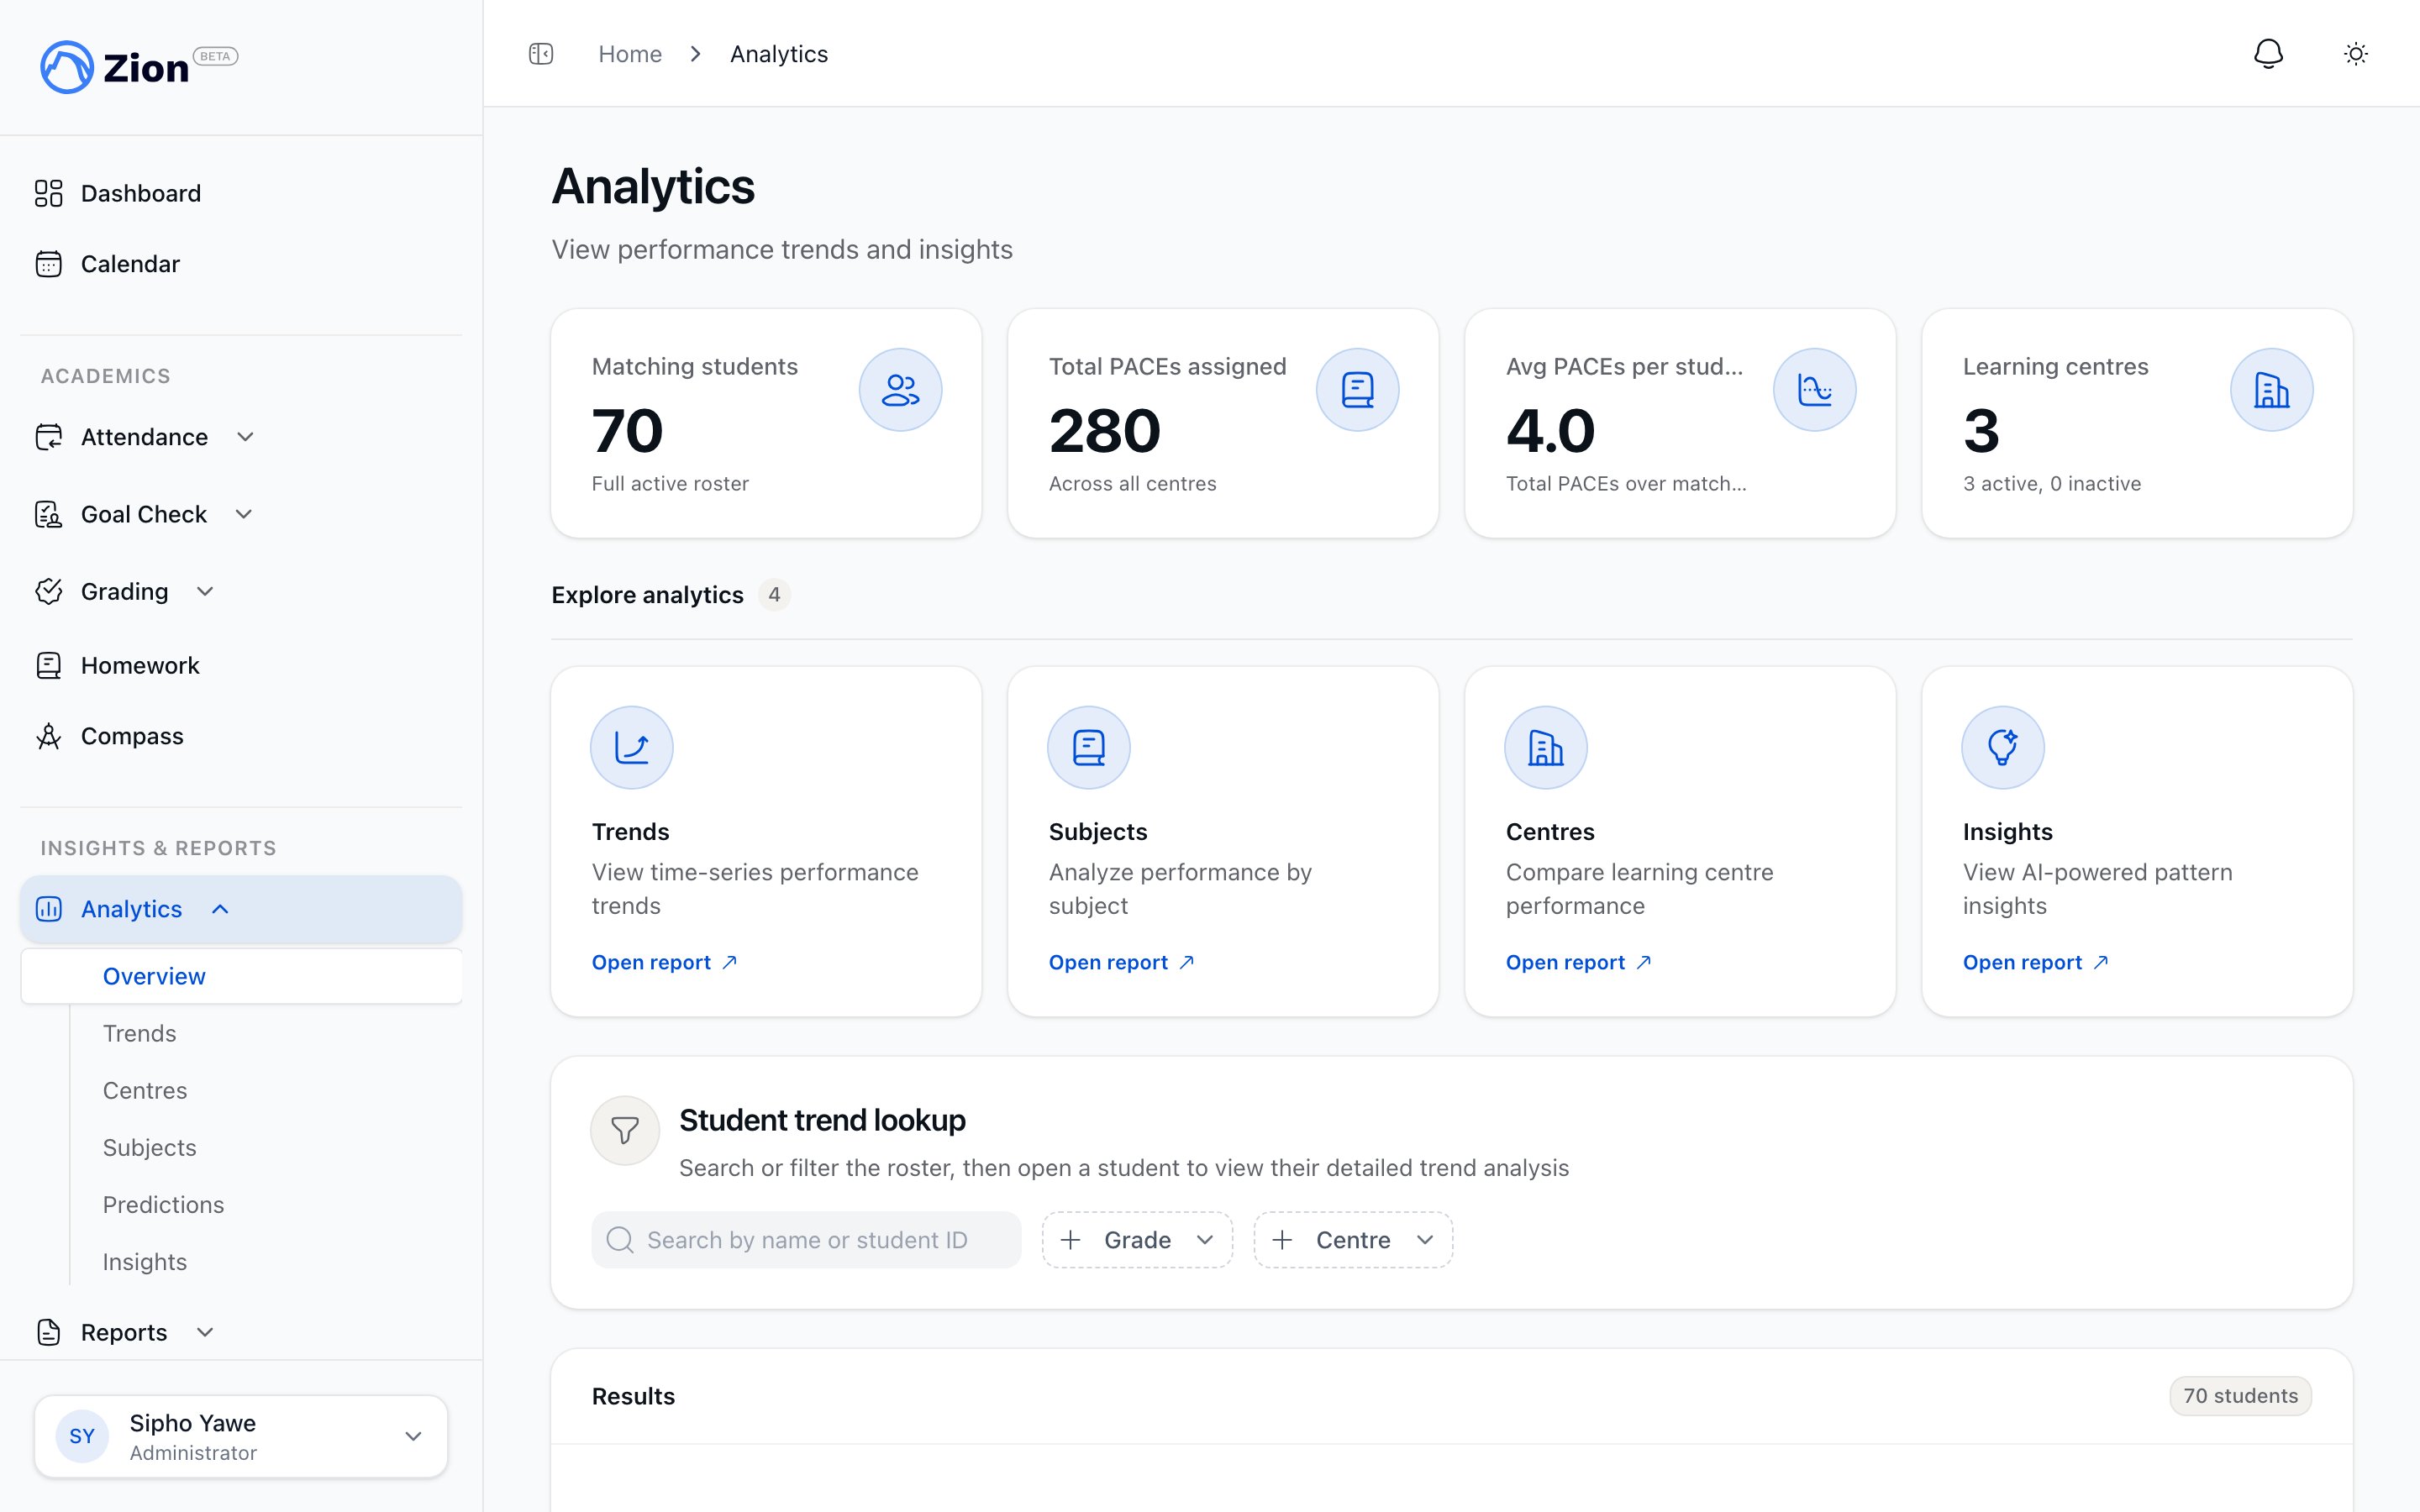
The analytics index with trends, subject and centre breakdowns, and predictions
Pattern Insights is administrator-only. Supervisors can use Trends and Predictions for their own centres, but the Insights page is not part of their view.
Trends
The Trends view charts goal-achievement over time for a student, subject, or centre. Pick a window of 7, 30, 60, or 90 days, or the current term, and the chart updates accordingly. From a student’s trend detail page you can also see:- Consecutive-misses highlighted directly on the chart
- A subject-level breakdown for that student
- A comparison against their centre’s average
- An intervention notes panel
- A printable Student Progress Report
Subject and centre breakdowns
Subjects
The subject view shows goal-achievement by subject, a grade-band by subject matrix, a PACE-level completion-rate table, and a radar overview. Filter by date range (7 days, 30 days, or current term), grade band (1 to 4, 5 to 8, 9 to 12, or all), and subject. Export the filtered view as CSV or PDF.Centres
The centre view compares learning centres on goal achievement: mean and standard deviation across centres, outliers highlighted, a comparison chart, a top-5 and bottom-5 trend chart, and a full metrics table. Export as CSV.Predictions
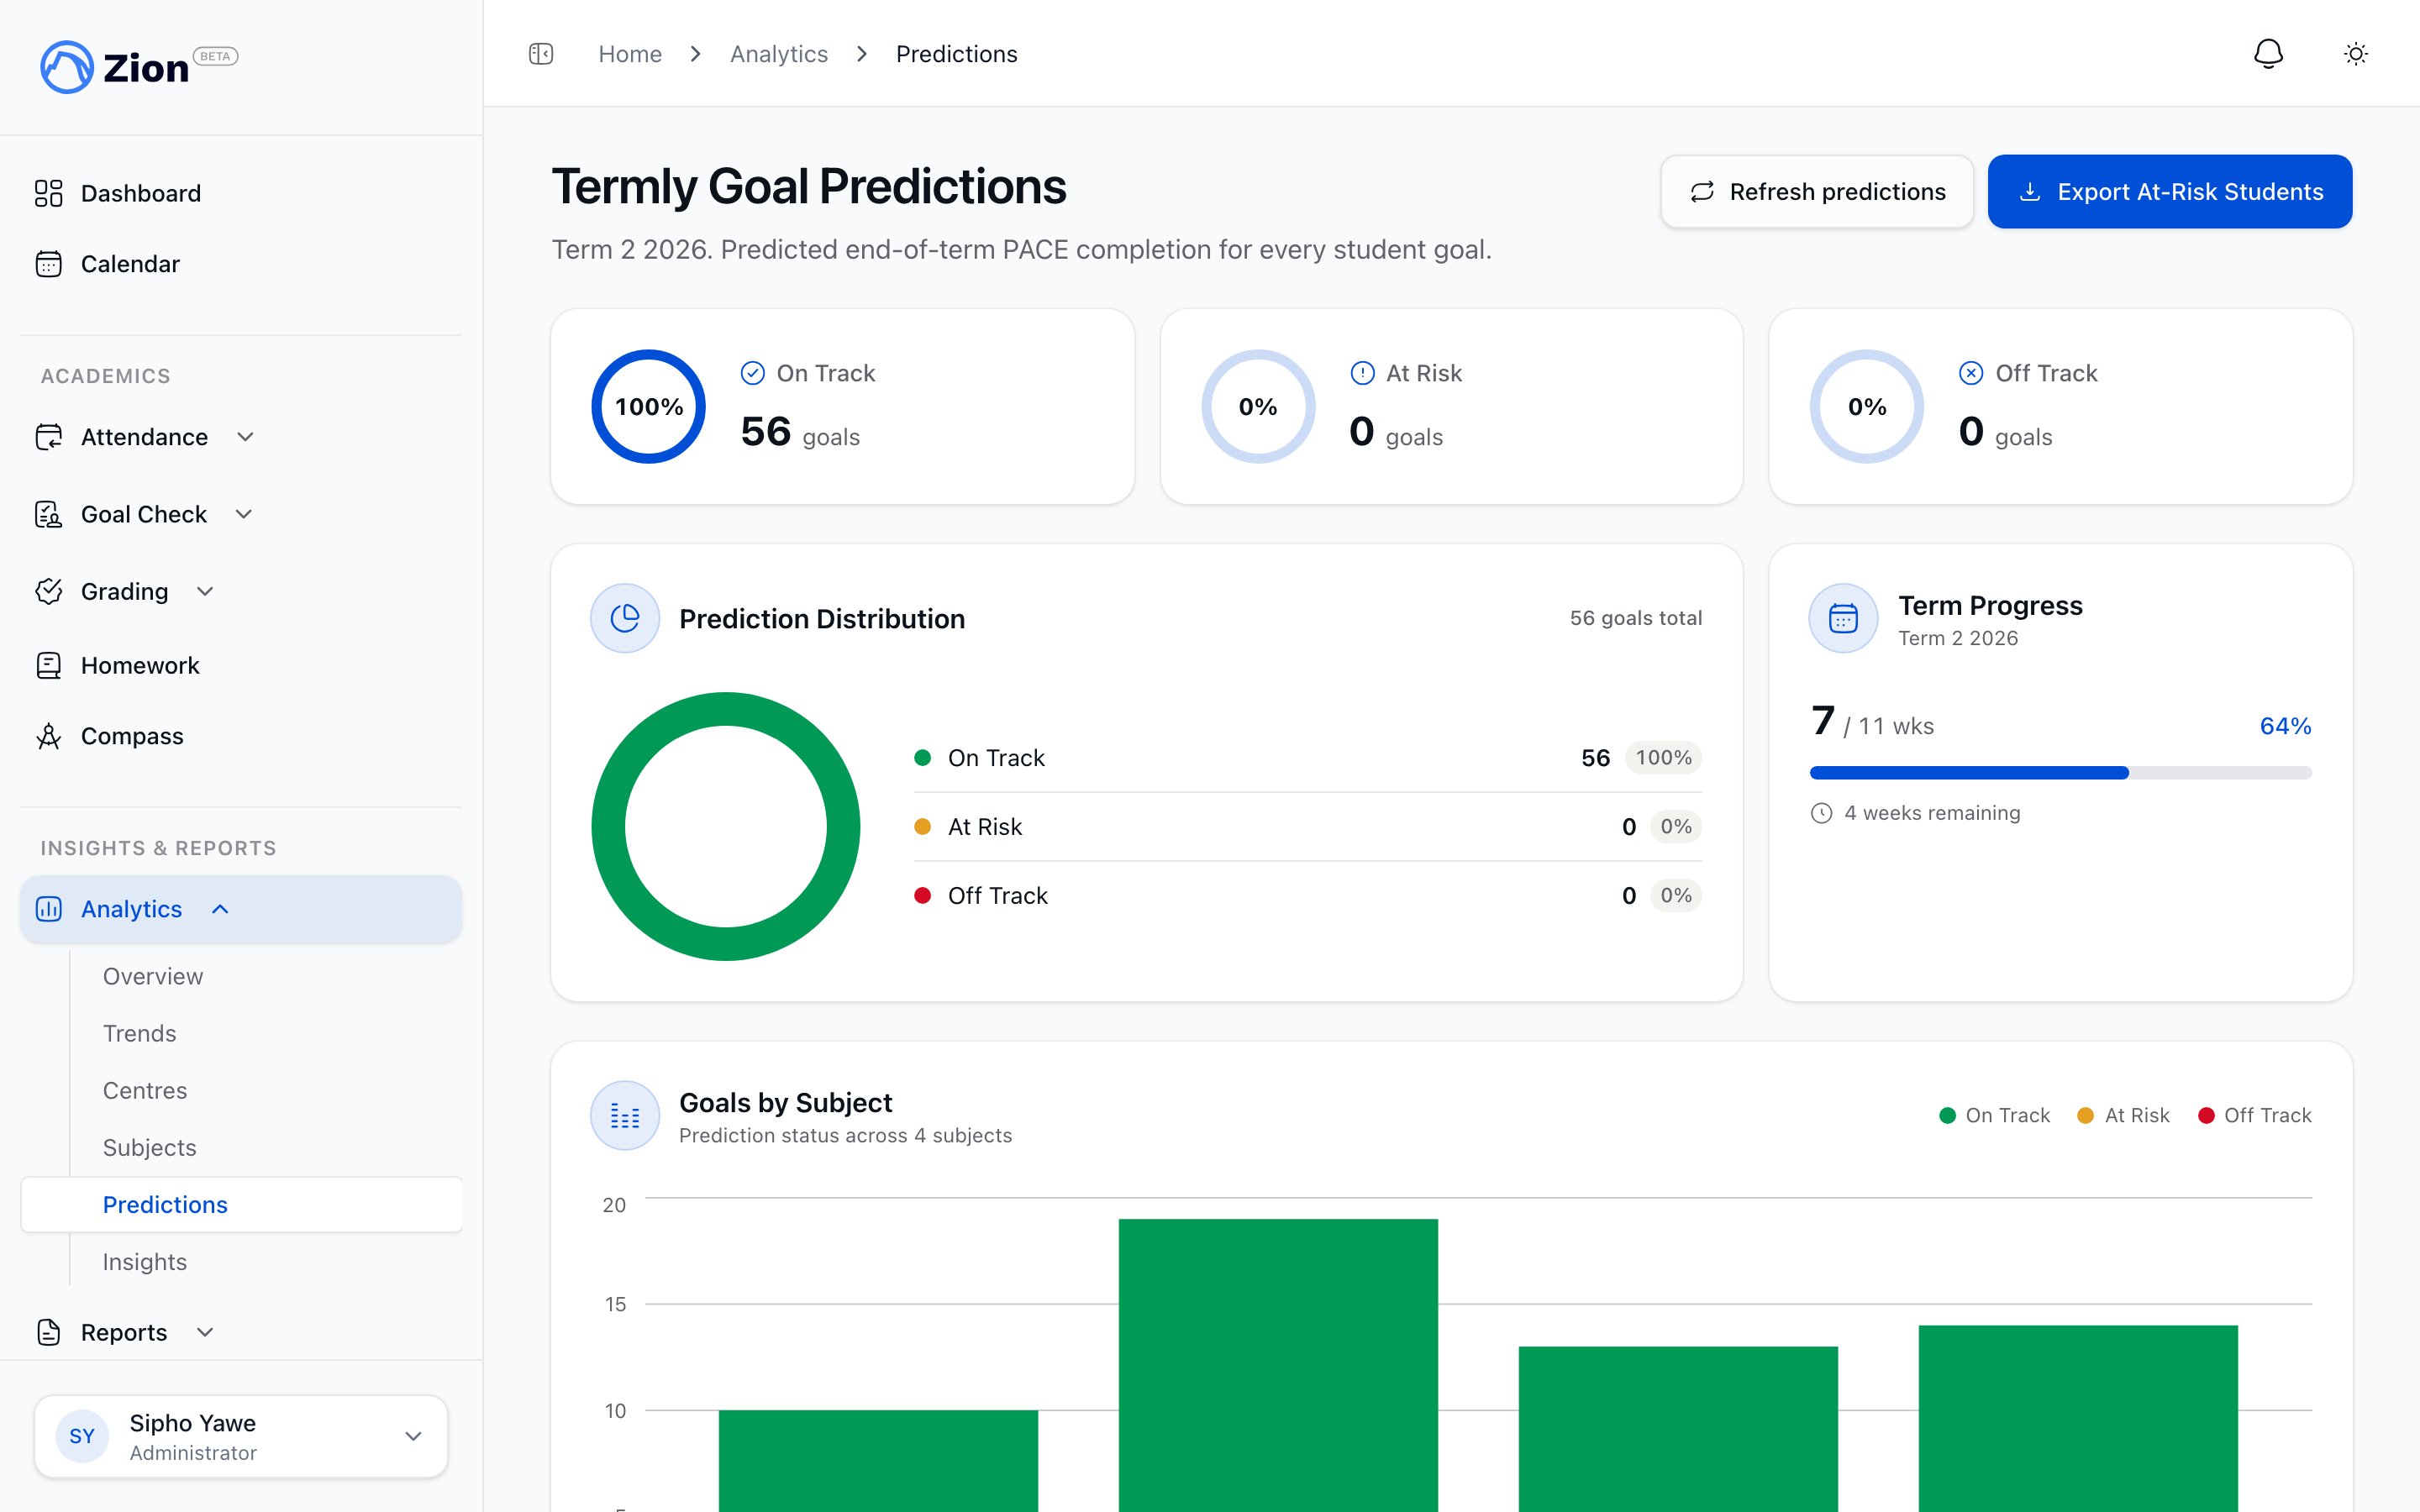
The predictions page showing on track, at risk, and off track student cards
The Predictions page shows a donut summary of on-track, at-risk, and off-track students, plus searchable and filterable student cards (by centre, status, and subject). Click a card to open a detail panel for that student and subject. Export the current at-risk and off-track list as CSV from Export At-Risk Students.
Predictions use the same calculation the parent and student “My Progress” views use, so a parent or student sees the same status you do for their record. It is read-only for them.
Pattern insights
Pattern Insights runs six statistical detectors across the school’s goal data and surfaces findings you might not notice by scanning trends manually.
Each insight carries a relevance score from 0 to 100 and a confidence level of high, medium, or low. Confidence reflects sample size: a finding based on a handful of goals is flagged low confidence even if the pattern looks strong, while a finding backed by dozens or hundreds of goals is flagged high confidence. Low confidence does not mean the finding is wrong. Treat it as worth watching rather than acting on immediately.
1
Review the insight
Read the title and description to understand what was detected.
2
Check confidence
Weigh the confidence level before committing to a major change.
3
View affected students
Open the insight’s detail drawer to see which students are involved, with their achievement rate and goals completed against goals attempted.
4
Plan and take action
Decide on a concrete step: a curriculum adjustment, a targeted intervention, a conversation with a centre supervisor.
5
Dismiss when resolved
Dismiss the insight once you have acted on it or decided it does not apply.
Generating and refreshing
Insights regenerate automatically on a weekly cycle. You can also click Generate Insights to run a fresh analysis on demand, useful after a batch of new data or before a leadership meeting. Generating replaces the current non-dismissed set with a new one. Insight generation, dismissal, and export require an active subscription on your organization.Filtering and export
Filter insights by confidence (all, high, medium, low) or by type (day-of-week, subject correlation, centre performance, seasonal trend, student velocity, subject difficulty). Insights sort by relevance score by default. Export a PDF of the full insight list, or export a single insight, from the Insights page.Building insight history
Pattern detection needs enough goal data to find a real signal. A school that has just started using Zion will see few or no insights at first. As daily goal data accumulates over several weeks, more patterns become detectable. Consistent daily goal marking across centres is what feeds this.Related pages
Insights overview
What pattern insights are and how they are generated
Insight types
Detail on each of the six detectors
Analytics
Trends, subject, and centre breakdowns in depth
Predictions
How termly-goal predictions are calculated