The supervisor dashboard, scoped to the learning centres you are assigned to
Today’s Routine
The Today’s Routine card is the entry point for the day’s Goal Check work. It shows the Morning Routine and End of Day status for each centre you supervise.- If a session has not started, the card shows a Start Morning Routine or Start End-of-Day Check button.
- If a session is already in progress, the button changes to Resume so you continue where you left off rather than starting over.
- If you supervise more than one centre, a centre selector appears above the button and each centre tracks its own Morning Routine and End of Day status independently.
If your organization requires goal sign-off, you can approve a completed morning session’s pending goals directly from the routine summary screen. Monitors cannot approve, so this action is limited to supervisors and administrators.
Centre progress
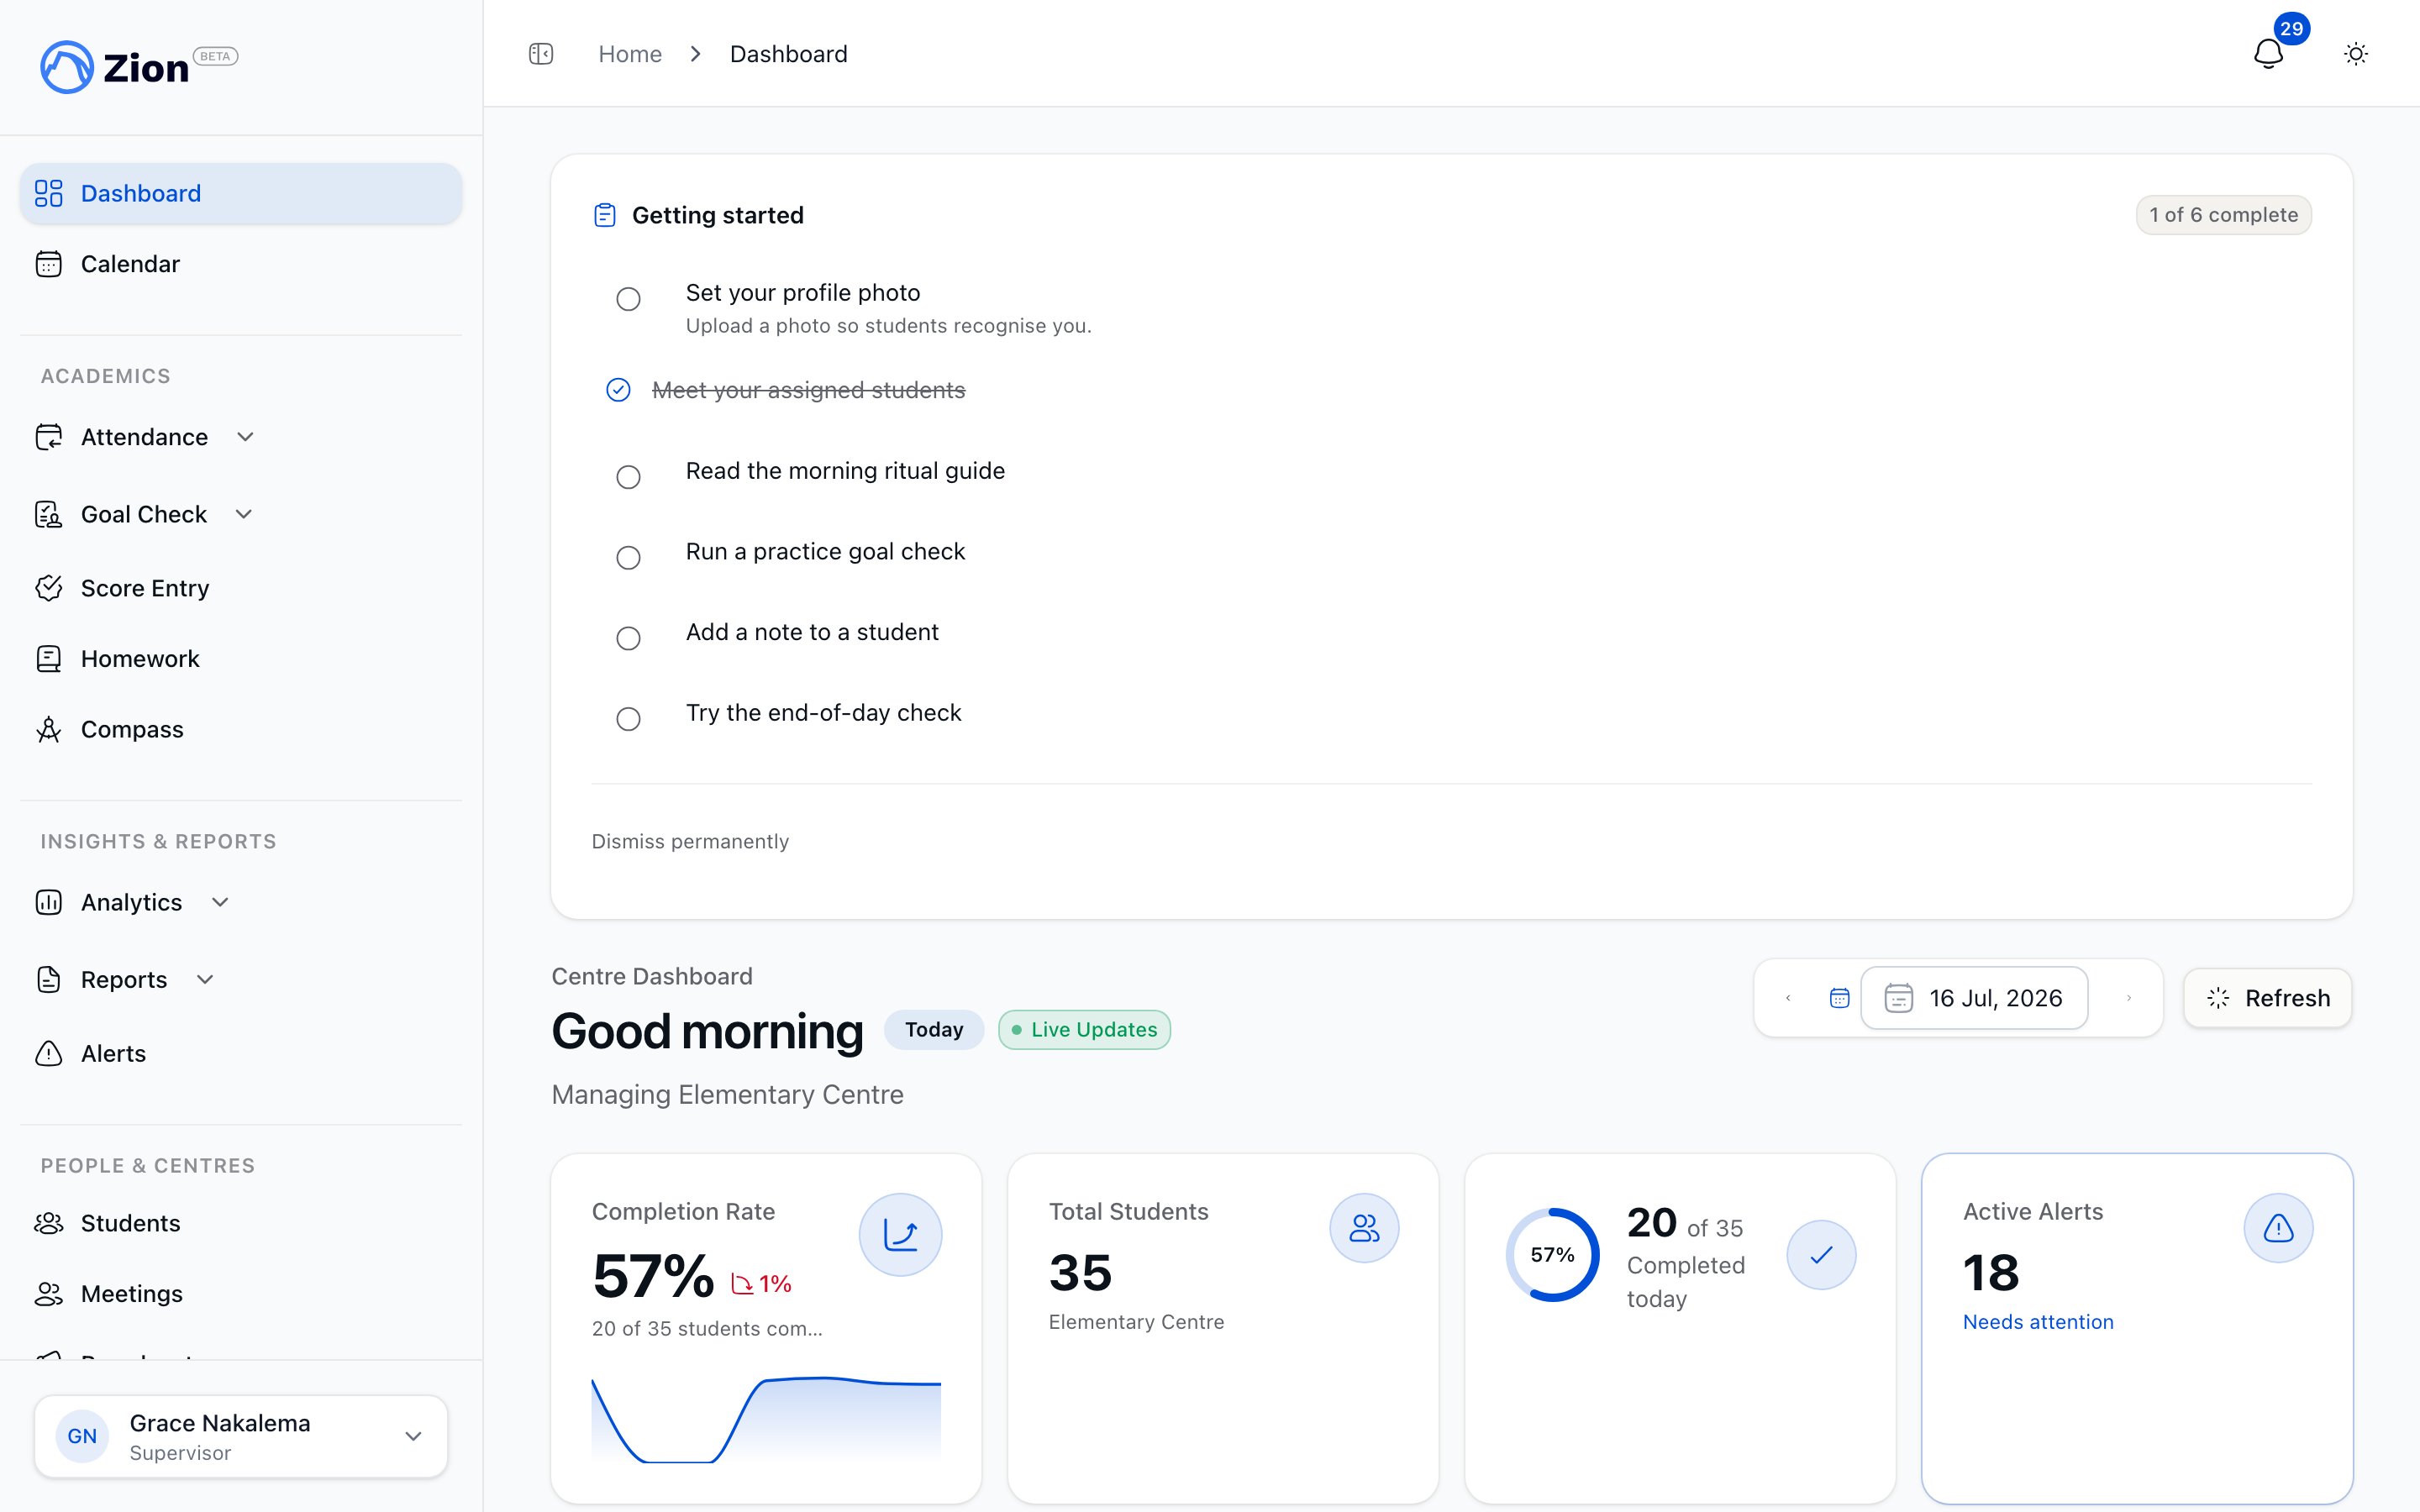
Below the routine card, the dashboard shows how your centres are doing on Goal Check for the day: how many students have goals set, how many have progress marked, and how many met their goals. Numbers update as routine sessions run and as standalone entries are made, since both write to the same underlying data. If you supervise multiple centres, filter or switch between them to see each one’s numbers separately rather than combined.Attendance snapshot
Supervisors have their own attendance dashboard, alerts, and trend views, scoped to the centres they are assigned to. From the main dashboard you can jump into:- The attendance dashboard for present, absent, and late counts across your centres
- Attendance alerts, generated when a student crosses a consecutive-absence threshold or a 30-day absence-rate threshold set for your organization
- Attendance trend charts
Alerts
Alerts surfaced on your dashboard combine attendance alerts (chronic absence) with Goal Check performance signals for your centres, such as students missing goals repeatedly or centres trending below the organization’s typical achievement rate. Acting on an attendance alert requires acknowledging it with intervention notes, or dismissing it with a reason. Both actions are logged.Trends
Supervisors can review Goal Check trends and termly-goal predictions for their assigned centres at a level scoped to their assignment, not the full school. Trend data covers a selectable window (recent days or the current term) and shows whether achievement is improving, stable, or declining. Predictions classify students as on track, at risk, or off track for their termly PACE-count goal, using the same projection the parent and student progress views show for that child.Pattern Insights (statistical patterns like day-of-week effects, subject correlations, and centre comparisons) are an administrator-only surface and do not appear on the supervisor dashboard.
Next steps
The daily routine
Run Morning Routine and End of Day for a centre.
Supervisor guide: Goal Check
The full daily Goal Check workflow for supervisors.
Supervisor guide: attendance
Mark attendance and work chronic-absence alerts for your centres.
Insights overview
How trend and prediction data is computed across the app.