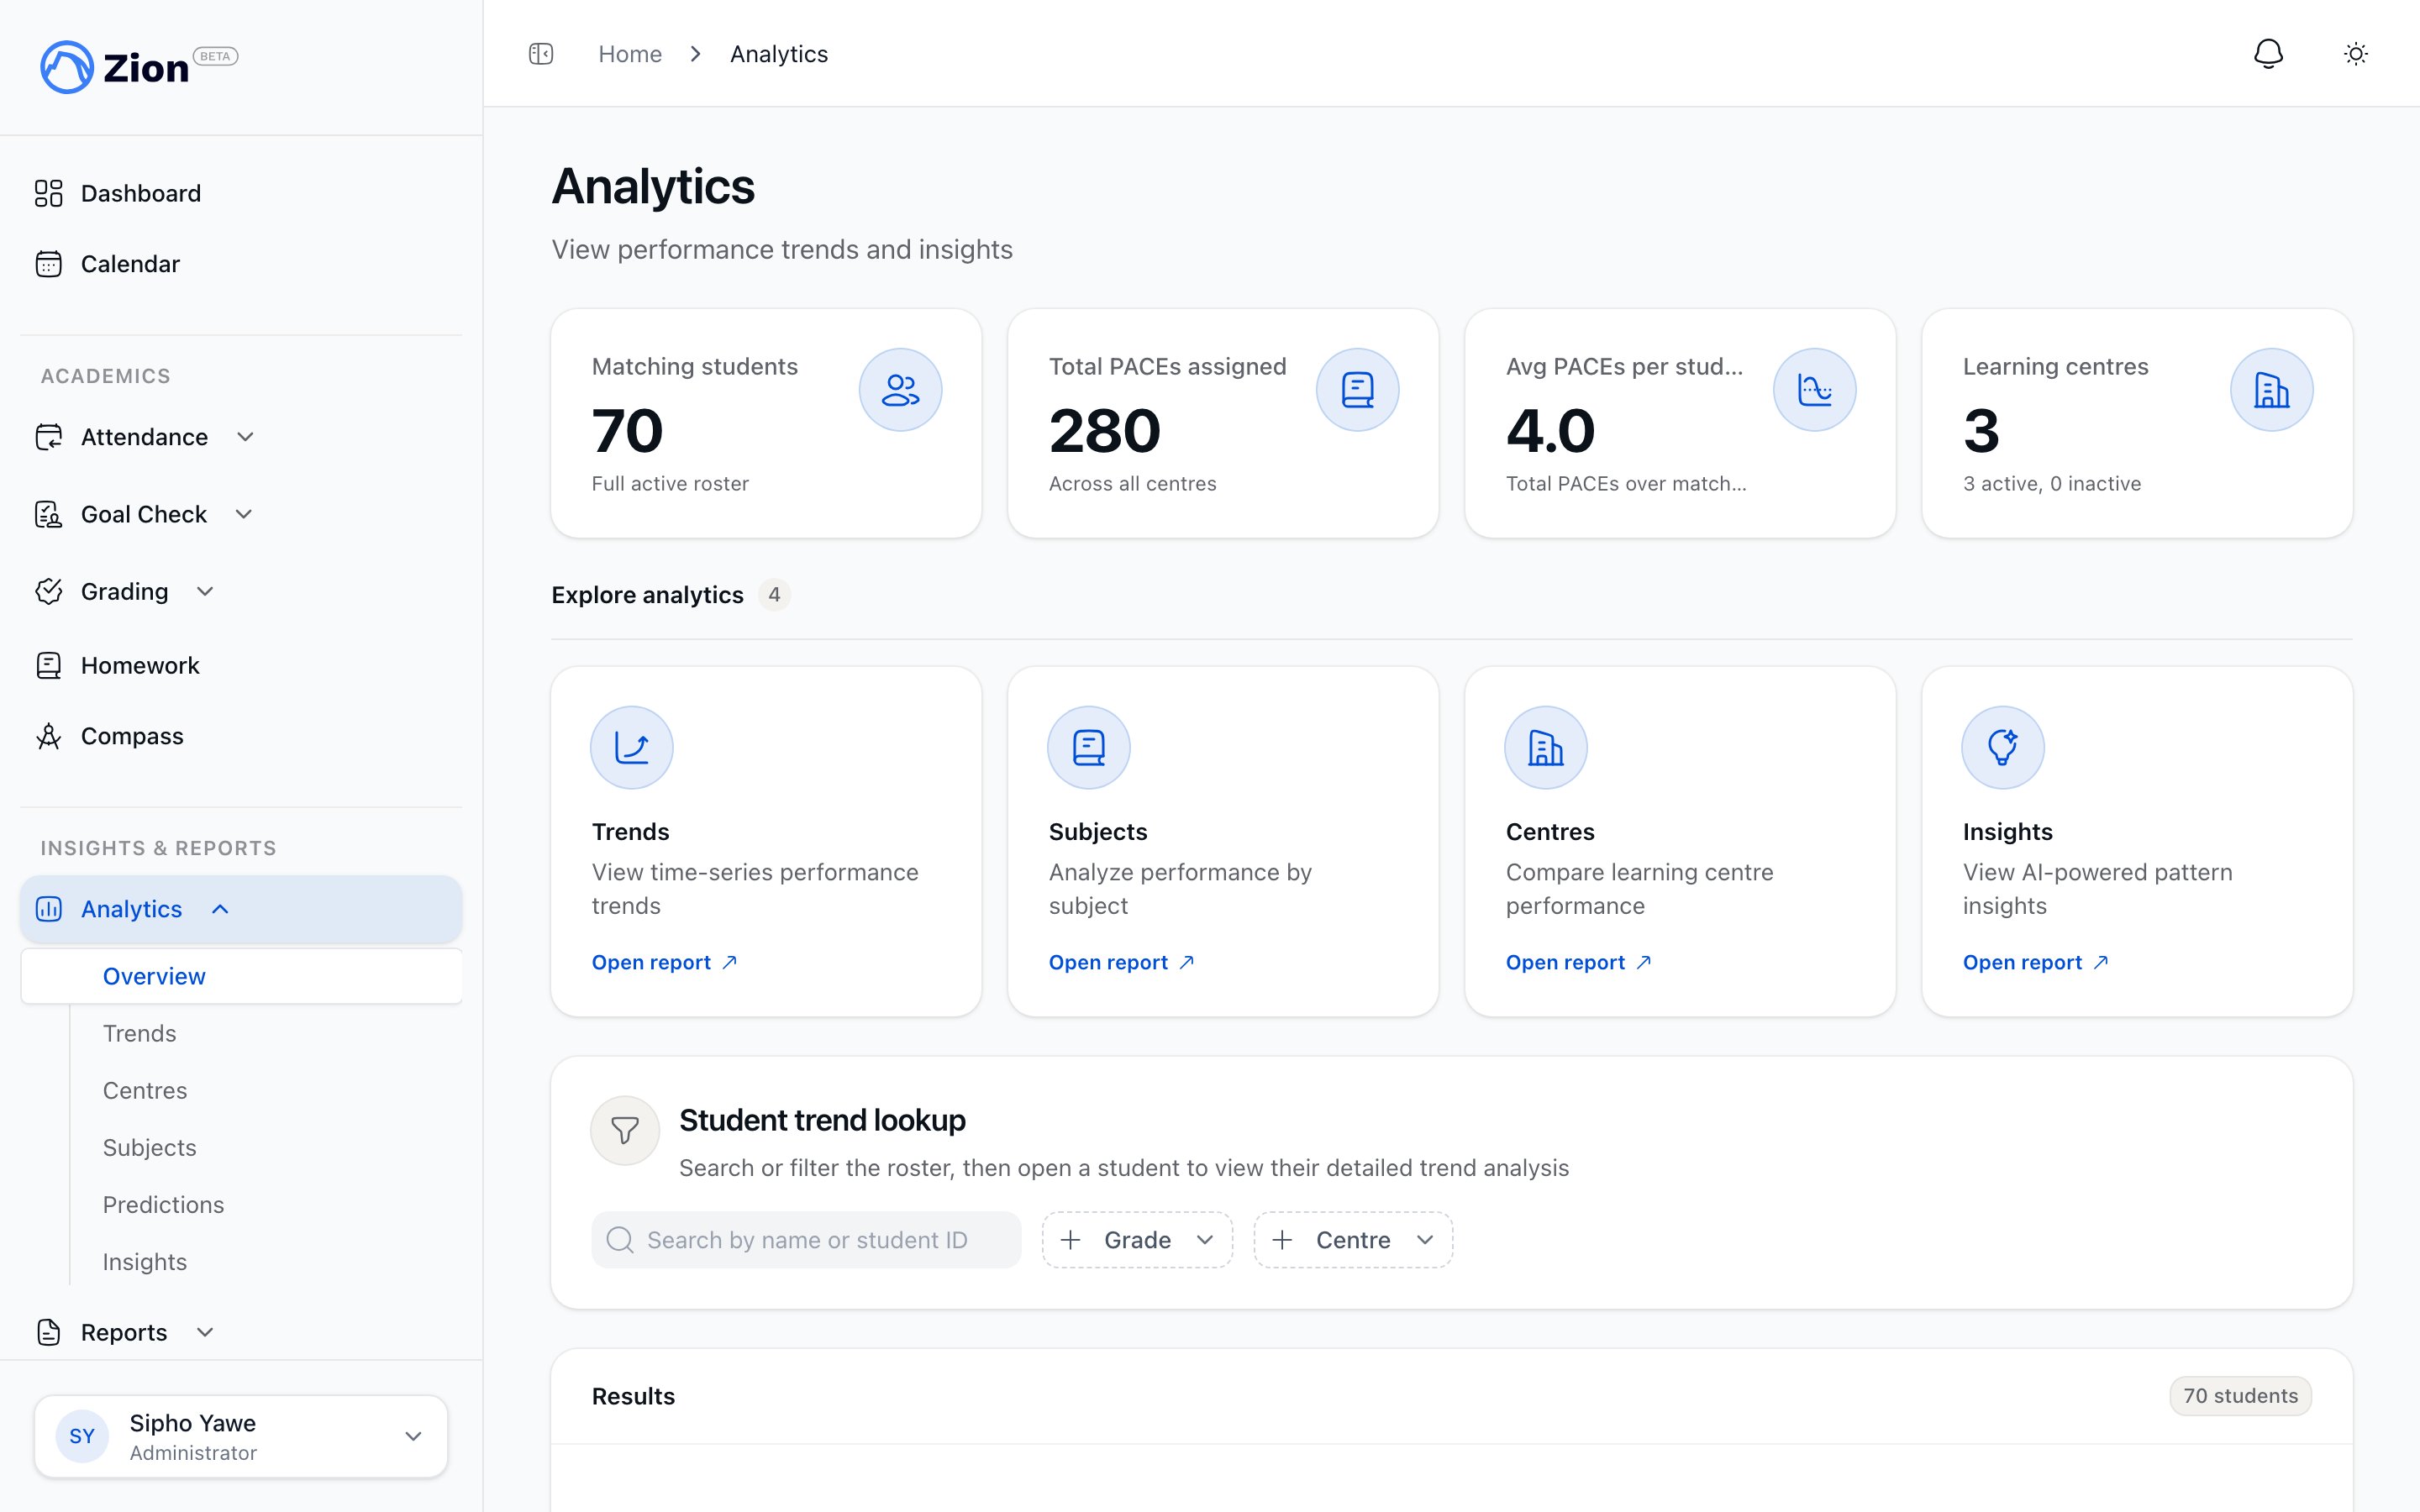
Insights Overview

Zion’s Insights module automatically analyzes your school’s data to surface actionable patterns and trends. Using statistical analysis, Zion identifies opportunities for intervention before problems escalate.

What are Insights?

Insights are automatically-generated, data-driven observations about patterns in your school’s performance data. Unlike raw reports that show what happened, insights explain what the data means and what you should do about it. Traditional Analysis (Manual):
  • Review reports and look for patterns
  • Mentally compare data across time periods
  • Requires statistical expertise
  • Time-consuming and error-prone
  • Easy to miss subtle patterns
Zion Insights (Automated):
  • Automatic pattern detection
  • Statistical validation of findings
  • Confidence scoring for reliability
  • Relevance ranking by impact
  • Actionable recommendations

How Insights Work

Automatic Detection

Zion analyzes your data continuously, looking for:
  1. Patterns: Recurring behaviors in the data
  2. Anomalies: Values outside normal ranges
  3. Correlations: Relationships between different metrics
  4. Trends: Changes over time

Statistical Validation

Each potential insight is validated:
  • Sample size requirements ensure reliability
  • Statistical tests confirm significance
  • False positives are filtered out
  • Only meaningful patterns surface

Confidence Scoring

Every insight includes a confidence level:
LevelSample SizeReliability
HighLarge samplesVery reliable
MediumModerate samplesReliable
LowSmall samplesInterpret with caution

Relevance Scoring

Insights are ranked 0-100 by relevance:
  • Impact Score (0-40): How significant is the finding?
  • Confidence Score (10-30): How reliable is the data?
  • Sample Score (0-30): Is the sample size adequate?
Higher scores indicate more actionable insights.

Types of Insights

Day-of-Week Patterns

What It Detects: Performance variations by day of week Example Insight: “Goal achievement is 25% lower on Mondays compared to the weekly average” What to Do:
  • Investigate Monday-specific challenges
  • Consider adjusted goals for Mondays
  • Address weekend-to-school transitions

Subject Correlations

What It Detects: Students struggling in multiple related subjects Example Insight: “Students struggling in Math 1042 are also struggling in Science 1040 (r=0.78)” What to Do:
  • Identify shared learning challenges
  • Check for prerequisite gaps
  • Consider paired tutoring

Centre Performance

What It Detects: Learning centres performing above or below average Example Insight: “Centre A is performing 18% below the school average” What to Do:
  • Investigate centre-specific factors
  • Consider supervisor support
  • Review resource allocation
What It Detects: Performance changes within a term Example Insight: “Achievement has declined 15% in the second half of this term” What to Do:
  • Address term fatigue
  • Review workload distribution
  • Consider engagement activities

Student Velocity

What It Detects: Individual students speeding up or slowing down Example Insight: “12 students have shown >25% improvement in the last 4 weeks” What to Do:
  • Celebrate and reinforce positive momentum
  • Identify what’s working for these students
  • Watch for students slowing down

Subject Difficulty

What It Detects: PACEs with unusually low completion rates Example Insight: “Math 1048 has a 62% completion rate, significantly below average” What to Do:
  • Review PACE content difficulty
  • Provide additional support resources
  • Consider teaching approach changes

The Insights Dashboard

Accessing Insights

  1. Navigate to Analytics in the sidebar
  2. Click Insights submenu
  3. View the insights dashboard

Dashboard Layout

Summary Cards:
  • Total active insights
  • High confidence count
  • Medium confidence count
  • Average relevance score
Filter Options:
  • By confidence level (High/Medium/Low/All)
  • By insight type (6 types or All)
Actions:
  • Refresh: Update insight list
  • Generate: Trigger new insight analysis
  • Export: Download insights report

Insight Cards

Each insight displays as a card showing:
  • Type Icon: Visual indicator of insight category
  • Title: Brief description of finding
  • Description: Detailed explanation
  • Confidence Meter: Visual progress bar
  • Relevance Score: 0-100 ranking
  • Created Date: When insight was generated

Working with Insights

Viewing Details

Click View Details on any insight card to see:
  • Full description and context
  • Affected students list (up to 20)
  • Student achievement data
  • Export option for deeper analysis

Dismissing Insights

If an insight is not relevant:
  1. Click Dismiss on the insight card
  2. Insight is hidden from view
  3. Recorded as dismissed (with timestamp)
  4. Won’t appear in future until new data warrants
Dismissing: Dismissed insights are permanently hidden. Only dismiss if you’ve addressed the issue or determined it’s not actionable.

Generating New Insights

Insights generate automatically weekly, but you can trigger manually:
  1. Click Generate Insights button
  2. System analyzes current data
  3. New insights appear within minutes
  4. Old non-dismissed insights are replaced

Dashboard Widget

Administrator Dashboard Integration

The main administrator dashboard includes an Insights Widget:
  • Shows top 3 most relevant insights
  • Quick preview format
  • Click to view full details
  • Link to complete insights page

Real-Time Updates

  • Widget refreshes with dashboard
  • Shows freshest insights
  • Highlights new insights since last view

Confidence Meter

Understanding the Meter

The visual confidence meter shows:
  • Full (100%): High confidence
  • Two-thirds (66%): Medium confidence
  • One-third (33%): Low confidence

Color Coding

  • Emerald (Green): High confidence
  • Blue: Medium confidence
  • Gray: Low confidence

Sample Size Requirements

Insight TypeHigh ConfidenceMediumLow
Day-of-Week>40 samples20-40<20
Correlations>30 students20-30<20
Centre Performance>60 goals40-60<40
Seasonal Trends>150 goals100-150<100

Best Practices

Regular Review

  • Check insights weekly at minimum
  • Prioritize high-confidence findings
  • Act on high-relevance scores first

Taking Action

  1. Analyze: Understand what the insight means
  2. Investigate: Look deeper into affected students/areas
  3. Plan: Develop intervention strategy
  4. Implement: Take concrete actions
  5. Monitor: Track improvement over time
  6. Dismiss: Once addressed, dismiss the insight

Building History

  • Insights build on historical data
  • More data = more reliable insights
  • New schools see limited insights initially
  • Full intelligence emerges over 4-6 weeks

Insight Validity

Expiration

Insights expire after 7 days:
  • Data continues to change
  • Old insights may no longer be relevant
  • System generates fresh insights weekly

Staleness Prevention

  • Expired insights auto-hide
  • Only current, relevant insights shown
  • Manual generation creates fresh analysis