Detected pattern insights with confidence levels and trend direction.
Day-of-week patterns
What it analyzes
Goal achievement variation across the days of the week.Detection method
A day of the week needs at least 10 goals recorded on that day to be considered. The detector compares that day’s average achievement rate to the weekly average and flags the day if the variance exceeds 10 percentage points.Example insights
Low-performance day: “Goal achievement is 18% lower on Fridays compared to the weekly average of 82%.” High-performance day: “Students perform 12% better on Tuesdays, the strongest day of the week.”Confidence requirements
What to do
For low days:- Investigate day-specific factors such as Monday transitions or Friday fatigue
- Consider adjusted goals on the affected day
- Plan more engaging activities for that day
- Document what makes the day successful
- Consider applying the same conditions to other days
Subject correlations
What it analyzes
Relationships between a student’s performance in different subjects.Detection method
The detector requires at least 5 goals per subject per student and at least 15 students with data in both subjects being compared. It calculates the Pearson correlation coefficient between subject pairs and flags any pair where the correlation magnitude exceeds 0.7. A magnitude above 0.85 is labeled “very strong”; between 0.7 and 0.85 is labeled “strong.”Example insights
Shared struggle pattern: “Students struggling in Math 1042-1048 are also struggling in Science 1040-1045 (correlation: 0.78).” Shared challenge: “English and Social Studies show a strong correlation (0.82). Students struggling in one typically struggle in both.”Confidence requirements
What to do
- Investigate shared prerequisite gaps between the two subjects
- Consider paired tutoring or combined support sessions
- Review whether the subjects share foundational skills
Centre performance
What it analyzes
How each learning centre compares to the school-wide average.Detection method
The detector requires at least 20 goals per centre and at least 2 centres with valid data. It compares each centre’s achievement rate to the school-wide average and flags a centre if it differs by more than 15 percentage points.Example insights
Underperforming centre: “Learning Centre B is performing 22% below the school average (58% vs 80%).” High-performing centre: “Learning Centre A is 15% above average, the top performer at 95%.”Confidence requirements
What to do
For underperforming centres:- Investigate environmental factors and supervisor practices
- Consider resource reallocation or targeted support
- Check the corresponding centre_low_performance alert for the same signal
- Document the practices in place
- Share the approach with other centres
Seasonal trends
What it analyzes
Change in achievement rate between the first and second half of the current term.Detection method
The term must be at least 6 weeks in, with at least 50 total goals recorded and at least 25 goals in each half. The detector compares the achievement rate in the first half of the term to the second half and flags a change greater than 15%.Example insights
Declining performance: “Achievement has dropped 18% in the second half of this term (72%, down from 90%).” Improving performance: “Performance improved 22% in the term’s second half, a strong positive trend.”Confidence requirements
What to do
For declining trends:- Review workload distribution and address term fatigue
- Consider mid-term breaks or added engagement activities
- Document what changed and maintain it
- Recognize the progress with students and staff
Student velocity
What it analyzes
Individual students whose achievement rate is accelerating or decelerating.Detection method
A student needs at least 20 total goals across an 8-week window, with at least 5 goals in each 4-week half, to be evaluated. The detector compares the first 4 weeks to the last 4 weeks and marks a student as accelerating or decelerating if the change exceeds 25%. An org-level insight only fires if more than 20% of eligible students are accelerating, or more than 20% are decelerating.Example insights
Accelerating students: “8 students have improved their achievement rate by >30% in the last 4 weeks.” Decelerating students: “5 students have shown a >25% decline in recent weeks. Intervention needed.”What to do
For accelerating students:- Note what changed for them and reinforce it
- Consider peer mentor roles where appropriate
- Investigate the cause and schedule a student or parent meeting
- Set up an intervention plan and monitor closely
Subject difficulty
What it analyzes
PACEs with a completion rate below the expected range.Detection method
A PACE needs at least 10 attempts to be evaluated. The detector flags any PACE with a completion rate below 70%.Example insights
Difficult PACE: “Math 1048 has a 58% completion rate, well below the 85% expected.”Confidence requirements
What to do
- Review the PACE content for complexity and prerequisite coverage
- Provide additional support resources for that PACE
- Discuss the pattern with curriculum specialists
Comparing insight types
Working with insights
1
Generate or refresh
Click Generate Insights to run all six detectors against current data. This requires an active subscription and replaces the current set of non-dismissed insights.
2
Filter
Filter the list by confidence (all, high, medium, low) or by type (weekly pattern, subject correlation, centre performance, seasonal trend, student velocity, subject difficulty).
3
Drill into an insight
Click a card to open the insight detail drawer, which lists the specific students or centres affected by that pattern.
4
Dismiss or export
Dismiss an insight to remove it from the active list, or export a PDF of the full report or a single insight.
Insights expire 7 days after generation. Regenerate them to keep the list current, or rely on the weekly automatic refresh.
Related guides
Insights overview
Introduction to the insights system
Administrator insights guide
Turning insights into interventions
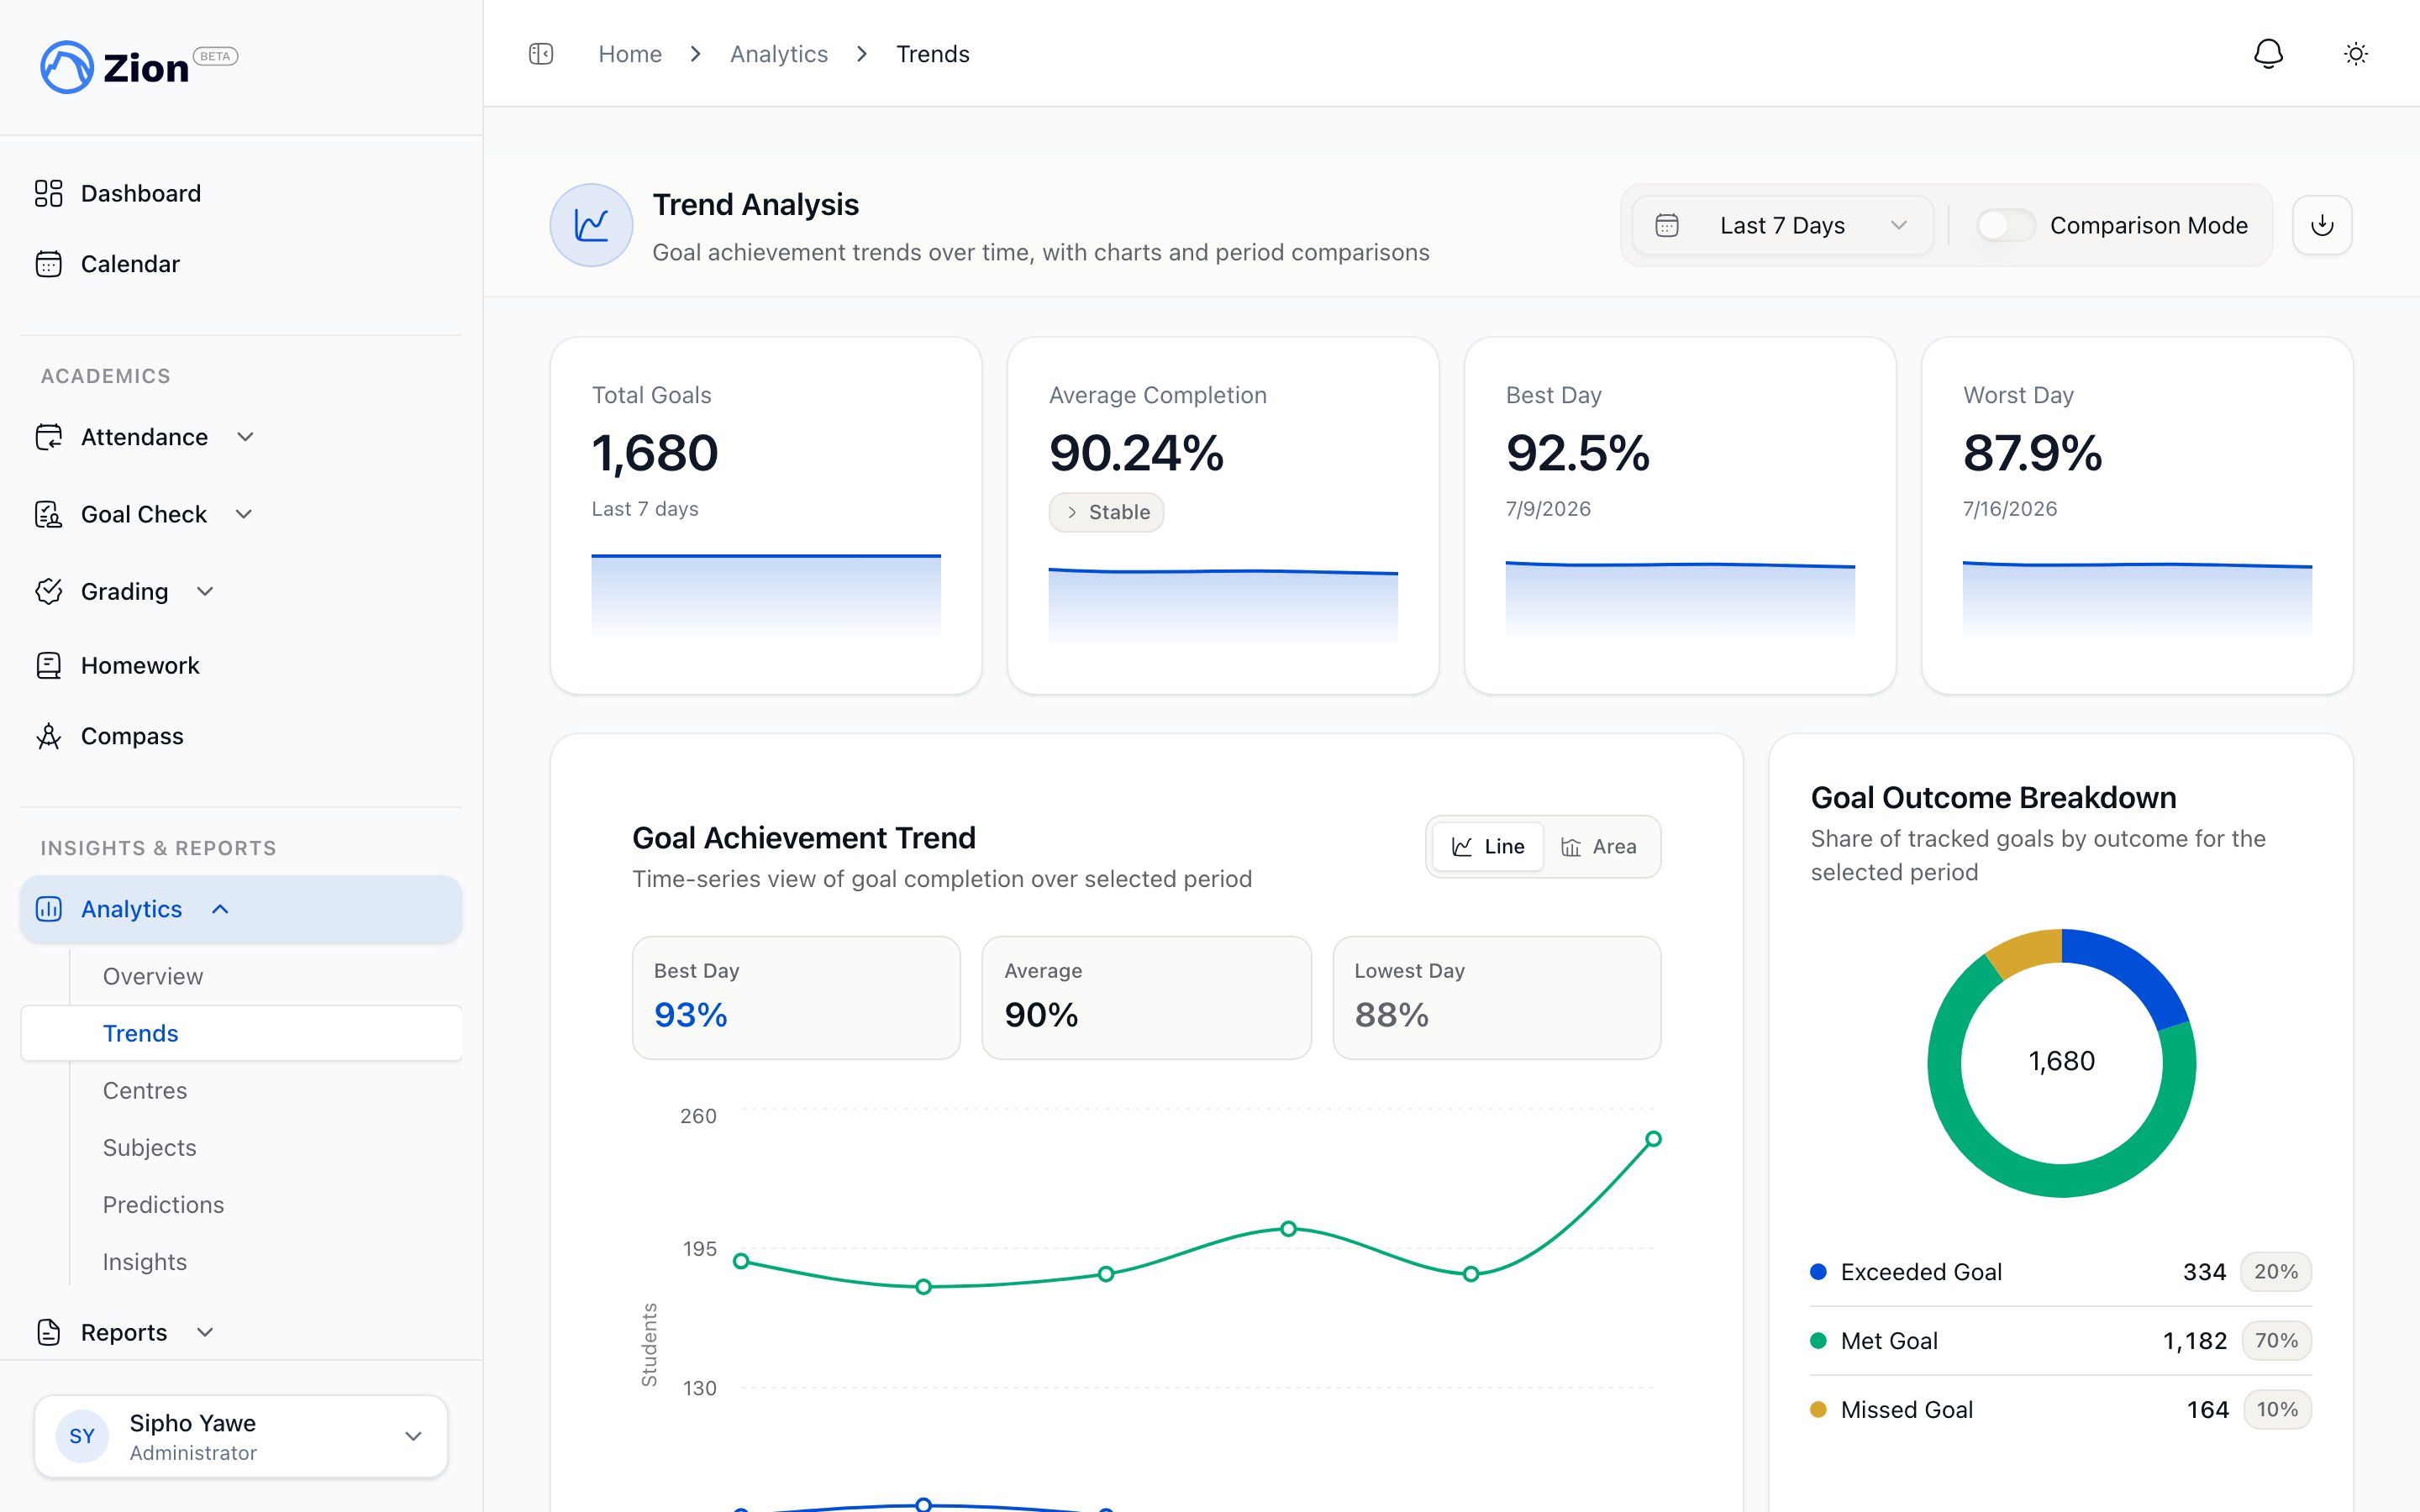
Analytics dashboard
Trends, subject and centre breakdowns, and predictions
Predictions
Per-student termly goal projections