Administrators are not limited to an assigned learning centre the way supervisors and monitors are. Every active centre in your school shows up in your routine centre selector, so you can start or resume the routine for any of them.
Morning Routine and End of Day across centres
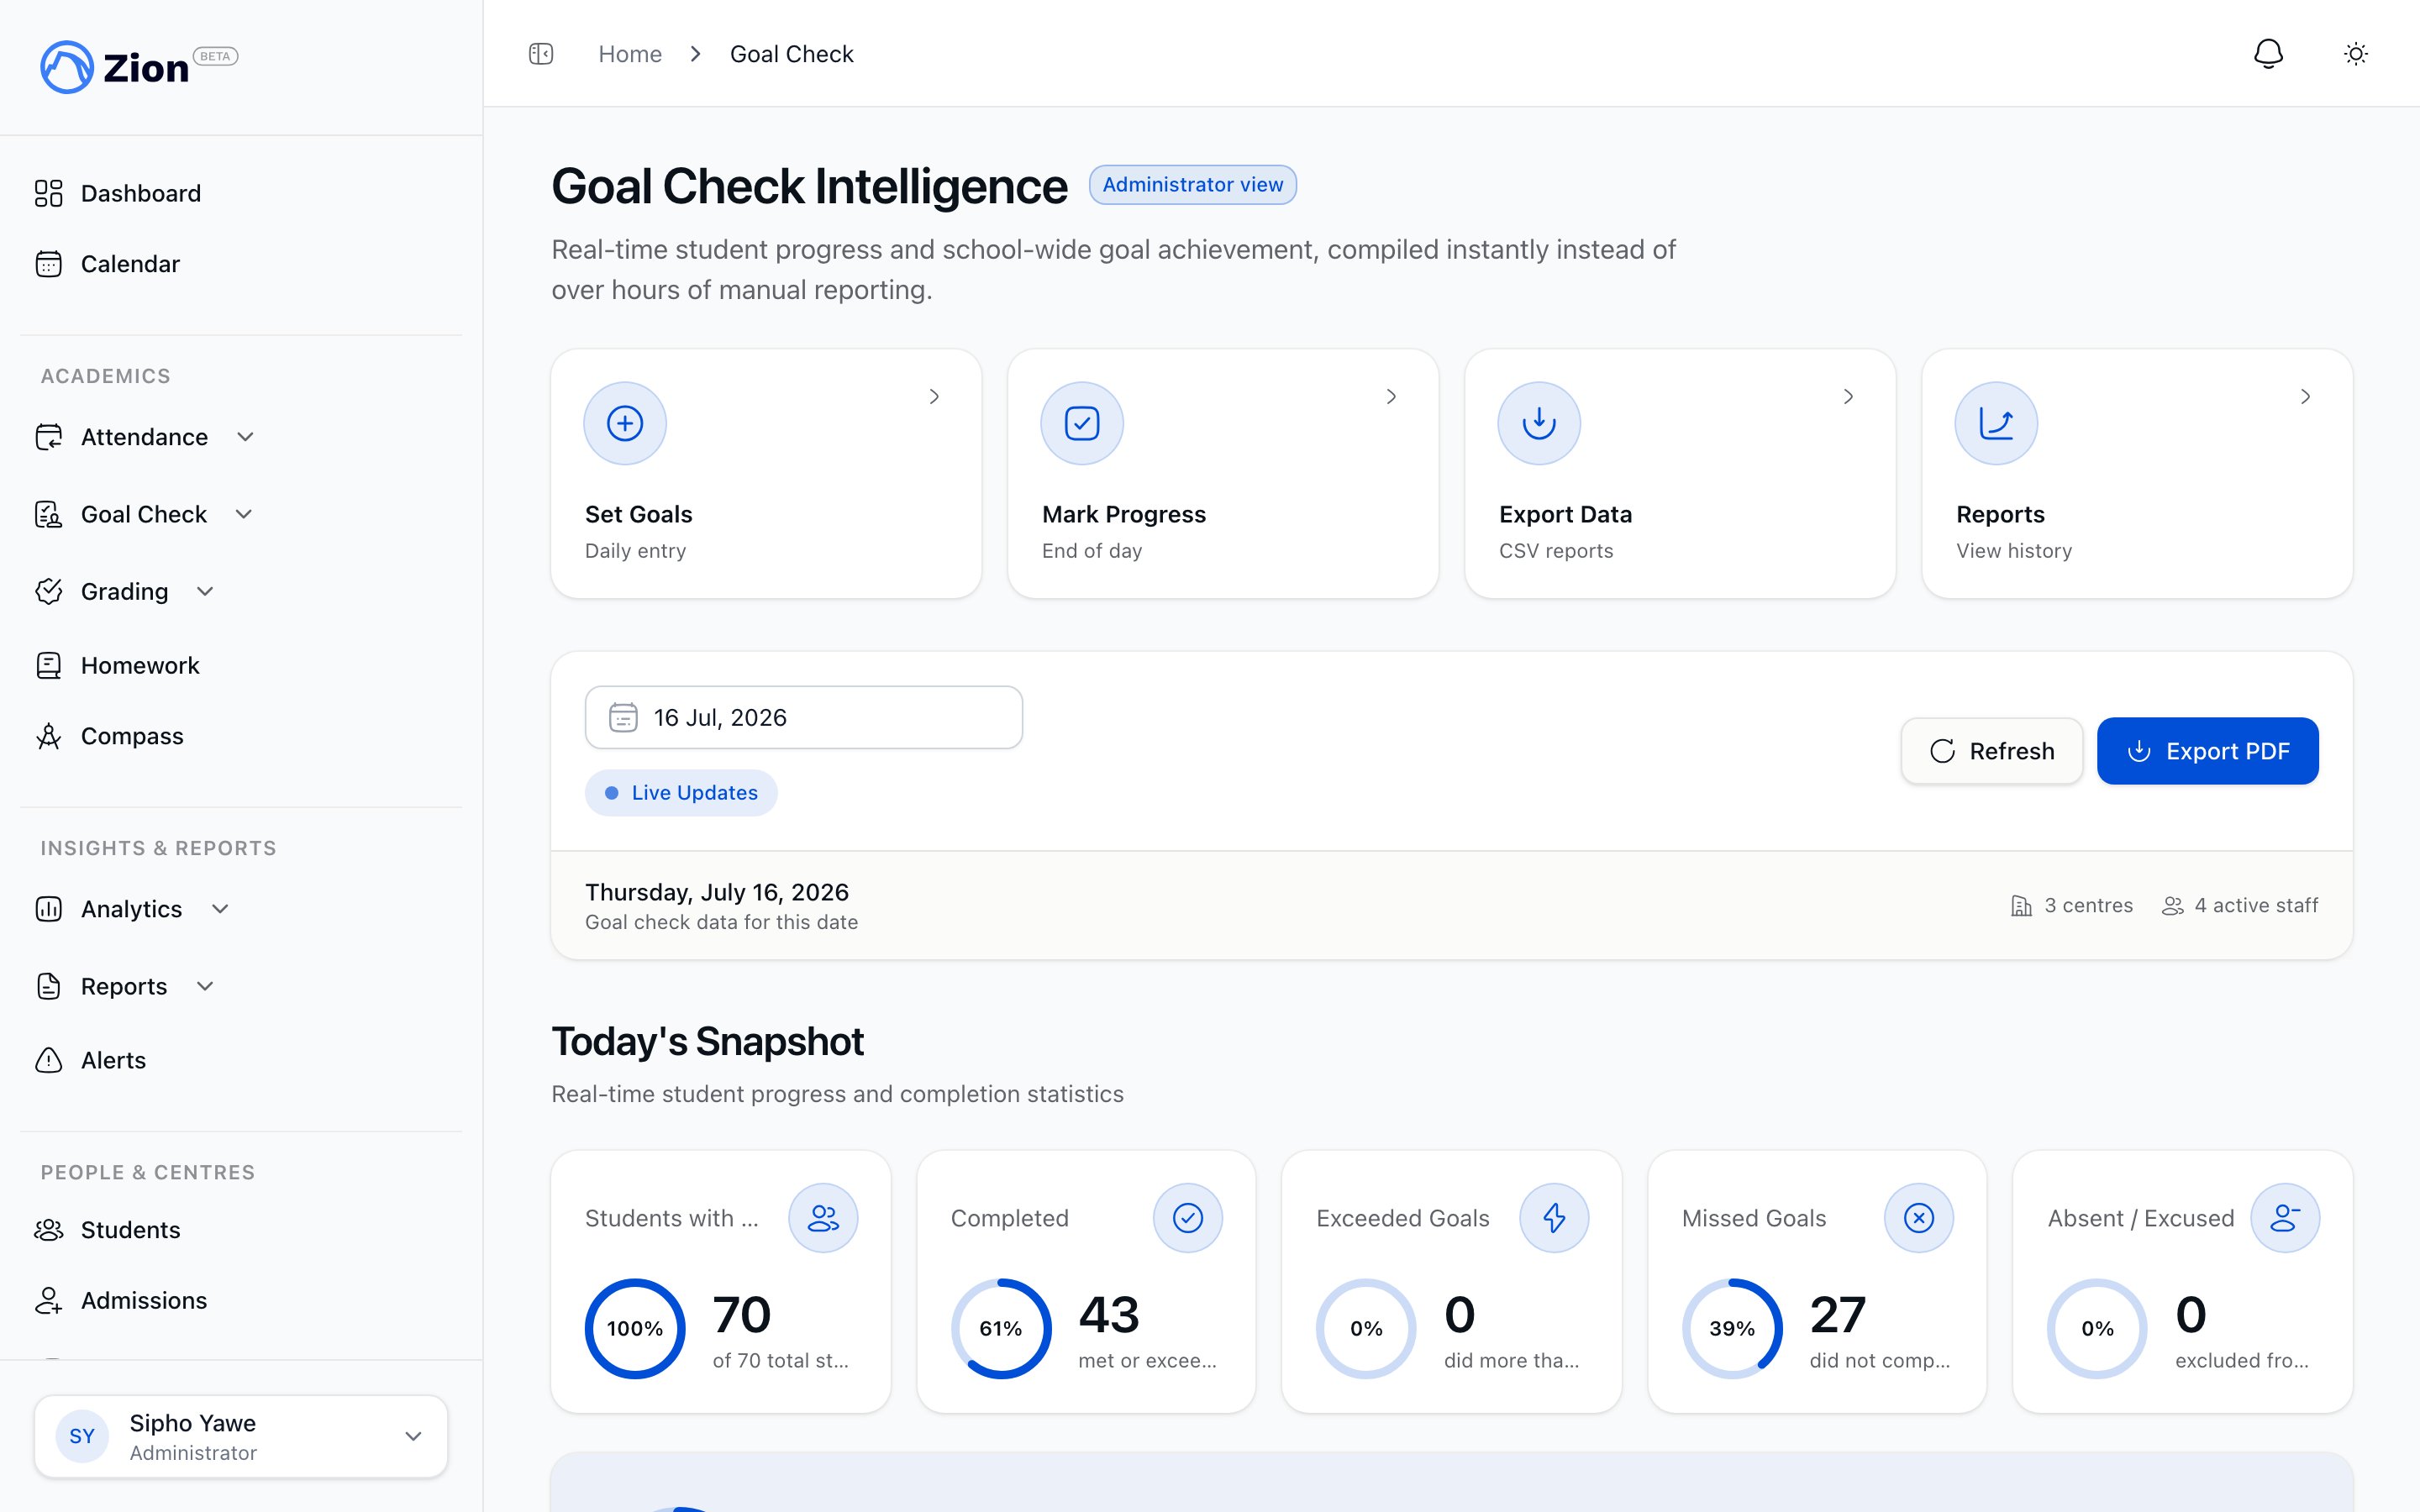
Goal Check Intelligence with today's snapshot and quick actions for goals, marking, exports, and reports
- Morning Routine: for each student, enter an end page for every active PACE. The start page is set for you automatically, based on the last page recorded.
- End of Day: for each student, review the PACEs goaled that morning and record Hit, Missed, or Partial along with the actual pages completed.
The Today’s Routine card on your dashboard
Your administrator dashboard includes a Today’s Routine card. If your school has more than one active learning centre, a Learning centre selector appears above the two buttons so you can check any centre, not just ones assigned to you. Each mode shows one of three states:
The card sits alongside, and never replaces, the standalone per-student Goal Check entry and progress-marking screens. Use whichever fits the moment: the routine to move an entire centre through goal setting or end-of-day marking in one pass, or the standalone screens to adjust a single student.
On the standalone progress-marking screen, staff can also record a day that was not a normal PACE attempt: mark a student Absent or Excused, or note that a present student spent the day on non-PACE work, such as review, an essay, a science project, or a special activity, and add an optional reason. These entries do not count as a completion attempt, so they are left out of insights and trend reports rather than counted against the student.
Optional goal approval
Zion supports a school-wide setting that requires a sign-off on morning goals before they count as final. It is off by default, so goals entered in the routine are live immediately unless you turn it on.1
Turn on the setting
On the School tab in Settings, enable Require goal approval in the Routine. When on, goals entered during Morning Routine start as pending until a supervisor or administrator signs them off.
2
Run or wait for a Morning Routine session
Any completed morning session for a centre now carries goals in a pending state until approved.
3
Approve from the routine summary
On the completion summary of a finished morning session, an approval panel shows a badge such as “3 goals pending approval.” Tap Approve all from this session to sign off every pending goal from that session in one action. Once every goal is approved, the badge changes to “All goals approved.”
Goal Check overview
What Goal Check tracks and how the daily cycle works
The daily routine
Full walkthrough of running Morning Routine and End of Day
Setting goals
Standalone per-student goal entry
Marking progress
Standalone per-student progress marking
Goal Check reports
Weekly reports across centres
School settings
Where the goal approval toggle and other school-wide settings live