

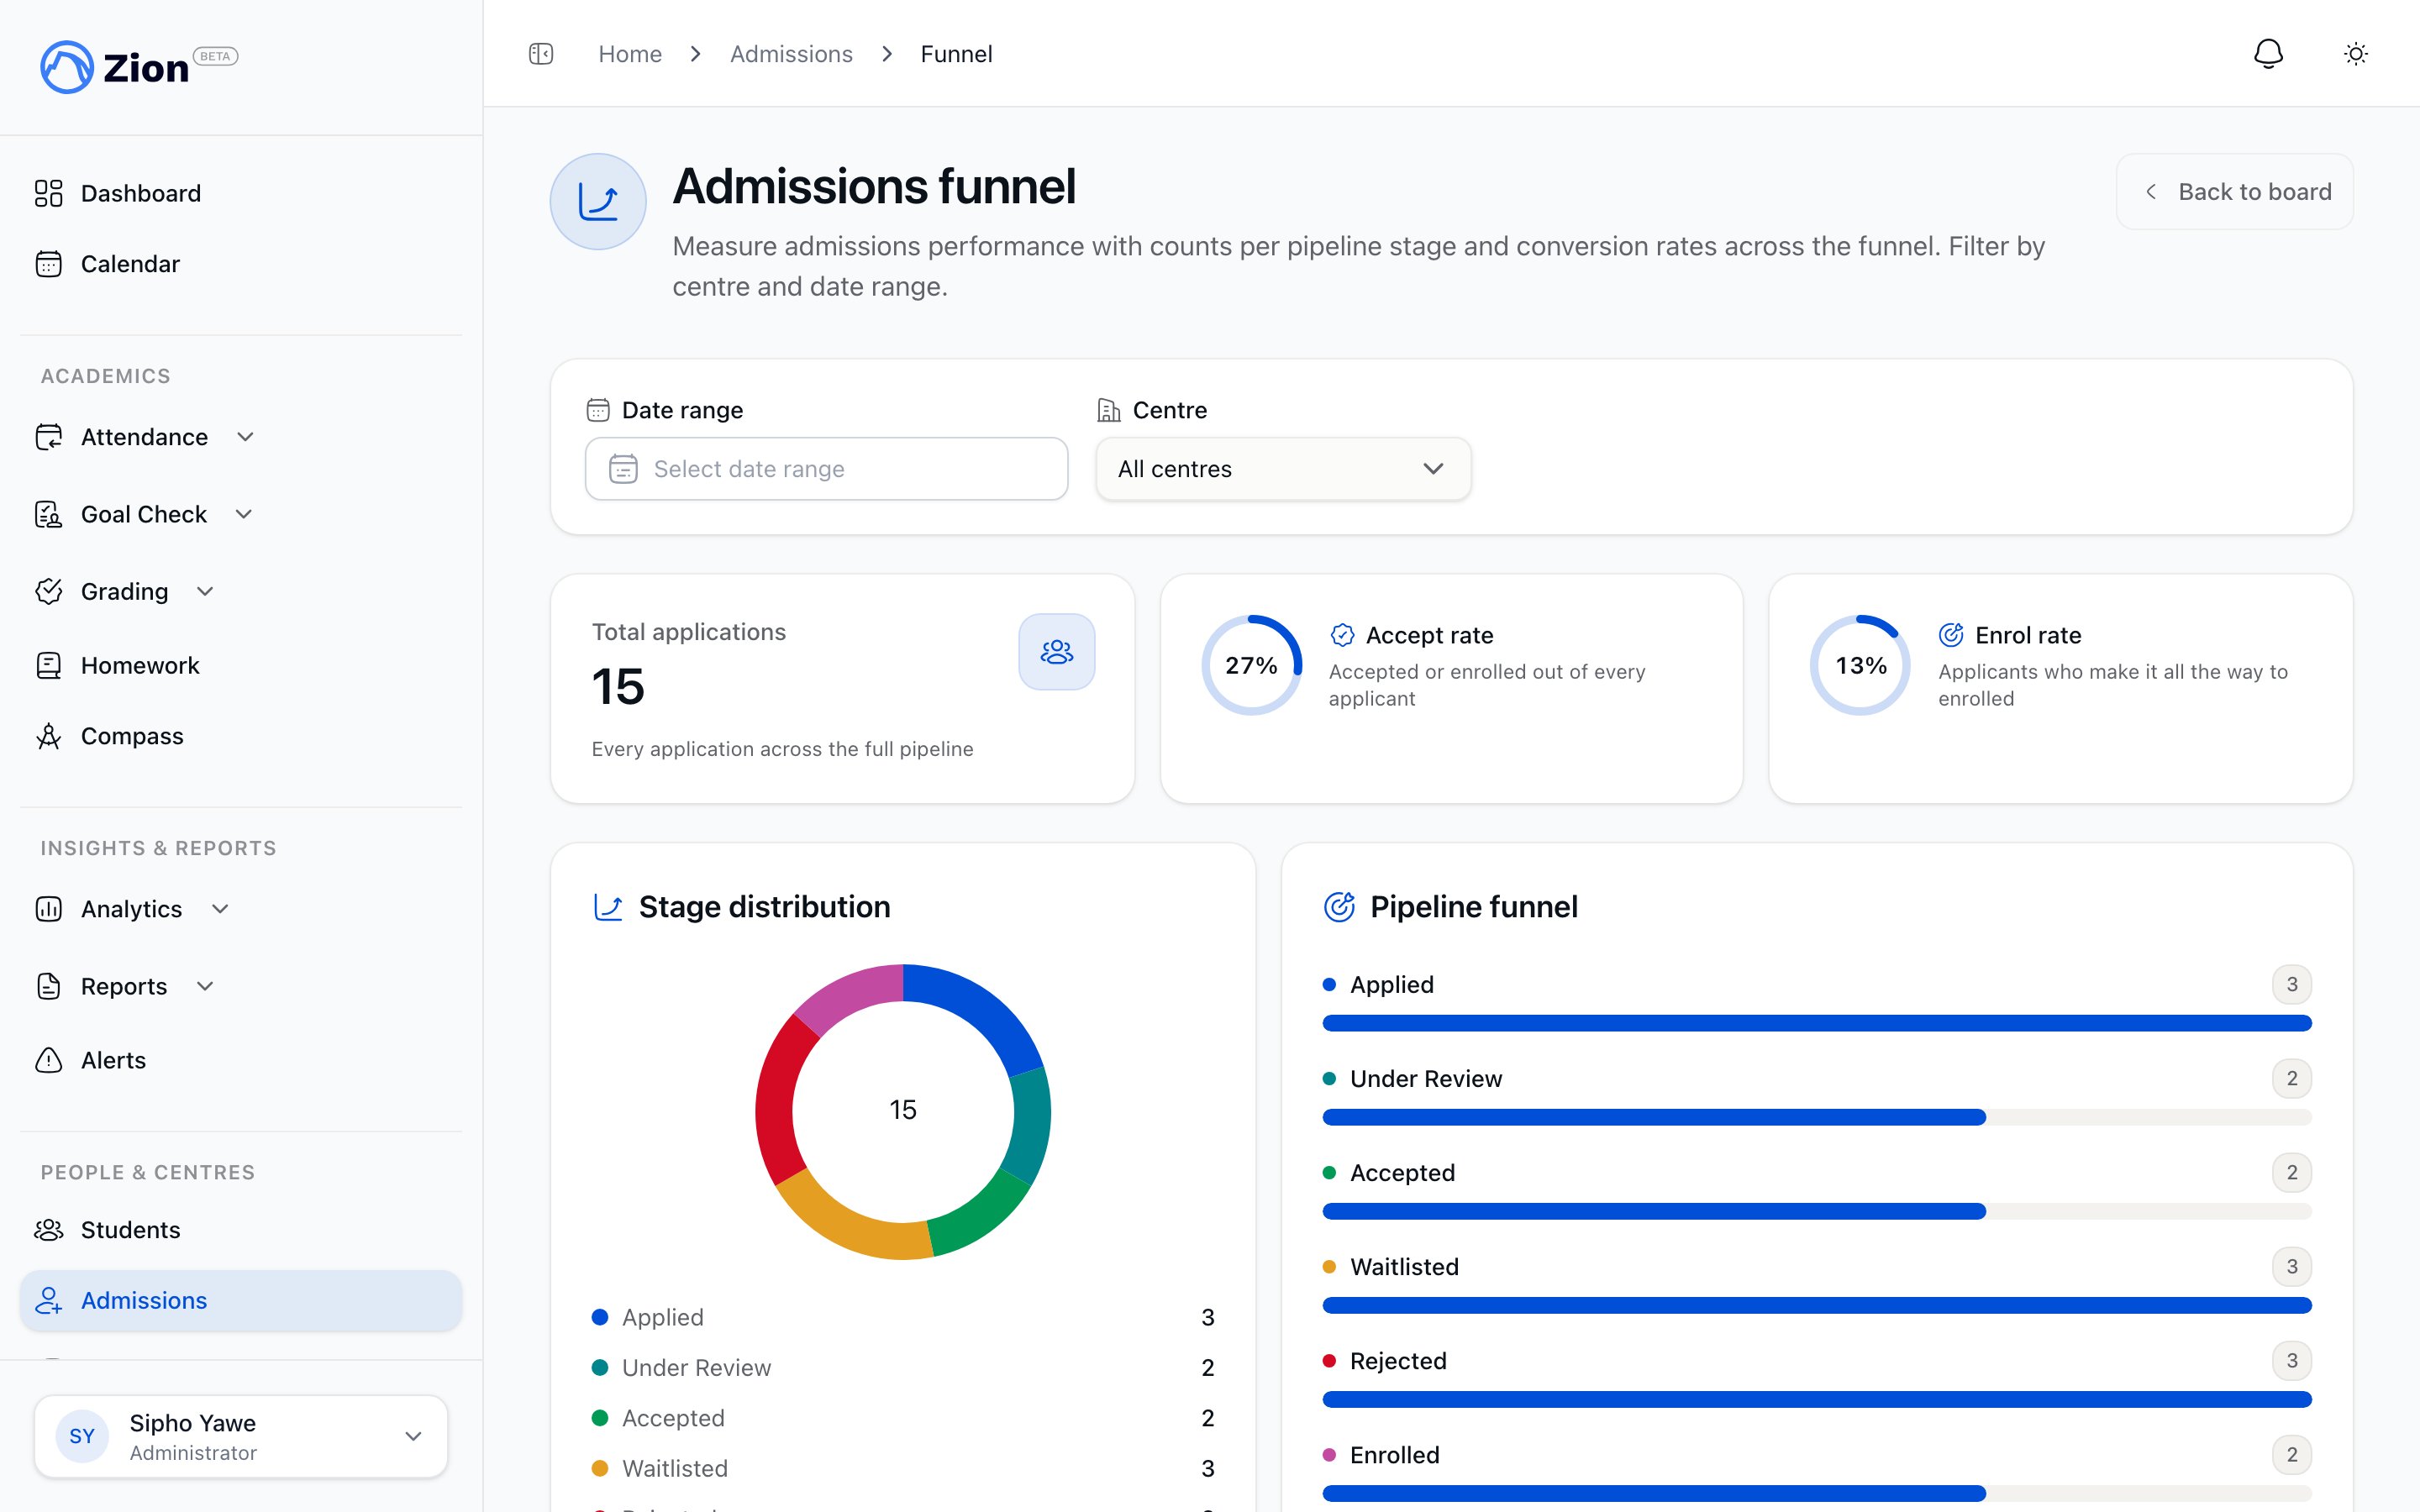
Applications by stage with accept and enrol rates
Funnel analytics requires an active subscription, the same as admissions write actions. An org without an active subscription cannot load this page.
Getting there
From the admissions board, click Funnel analytics in the page header.What the page shows
Summary tiles
Three tiles sit at the top of the page.Stage distribution and pipeline funnel
A donut chart breaks down every application by its current stage, with a count next to each stage in the legend. Next to it, a pipeline funnel shows the same six stages as a bar list: Applied, Under Review, Accepted, Waitlisted, Rejected, Enrolled. Bar length is scaled to the largest stage count, so it is a visual comparison, not a percentage.Conversion rates
A row of cards shows the conversion rate for each step along the main path:- Applied to Under Review
- Under Review to Accepted
- Accepted to Enrolled
Waitlisted and Rejected are terminal off-ramps. An application that moves to either status leaves the main path and is excluded from the step conversion rates, though it is still counted in Total applications and in its own stage bar.
How the rate is calculated
Conversion uses a cumulative-reach model, not a snapshot of who moved directly between two stages. An application currently sitting at a later main-path stage counts as having already reached every earlier main-path stage. For example, an Enrolled application is counted as having reached Applied, Under Review, and Accepted as well. This means the Under Review to Accepted rate reflects applications that are now Accepted or Enrolled, divided by applications that are now Under Review, Accepted, or Enrolled. If a stage has zero applications in scope, its dependent conversion rate shows as 0% rather than an error.Filters
Filters apply to every tile, bar, and conversion card on the page at once. If no applications match the current filters, the page shows an empty state instead of the charts.
Who can see this
Funnel analytics is restricted to the administrator role, the same as the admissions board and all admissions write actions. There is no CSV or PDF export for this page. It is an in-app dashboard only.Admissions overview
The six-stage pipeline and how applications enter it.
Managing applications
Working the kanban board and converting applicants to students.
Roles and permissions
Who can access each feature across the app.
Insights overview
Other analytics available across the app.