

Where to find it
- Administrator
- Supervisor
- Parent or student
Open Analytics from the sidebar, then select the Predictions card. This lands on the predictions dashboard with org-wide data across all learning centres.
How a projection is calculated
Zion computes one projection per student per subject, using PACEs completed so far and the pace at which the student is completing them.1
Velocity
Velocity is the student’s PACEs completed divided by the number of weeks elapsed in the term so far. Weeks elapsed is floored at 1, so a projection can be produced even in the first days of a term.
2
Projected total
The projected end-of-term PACE count is the PACEs already completed plus velocity multiplied by the weeks remaining in the term. Weeks remaining is floored at 0.
3
Status
The projected total is compared against the student’s termly PACE target for that subject to assign a status of on track, at risk, or off track.
Status thresholds
For a student with zero PACEs completed so far, Zion classifies status by how far into the term the class is, since there is no completion velocity yet to project from:
These thresholds are the same for every student and subject. Zion does not let staff adjust them from the dashboard.
Reading the dashboard
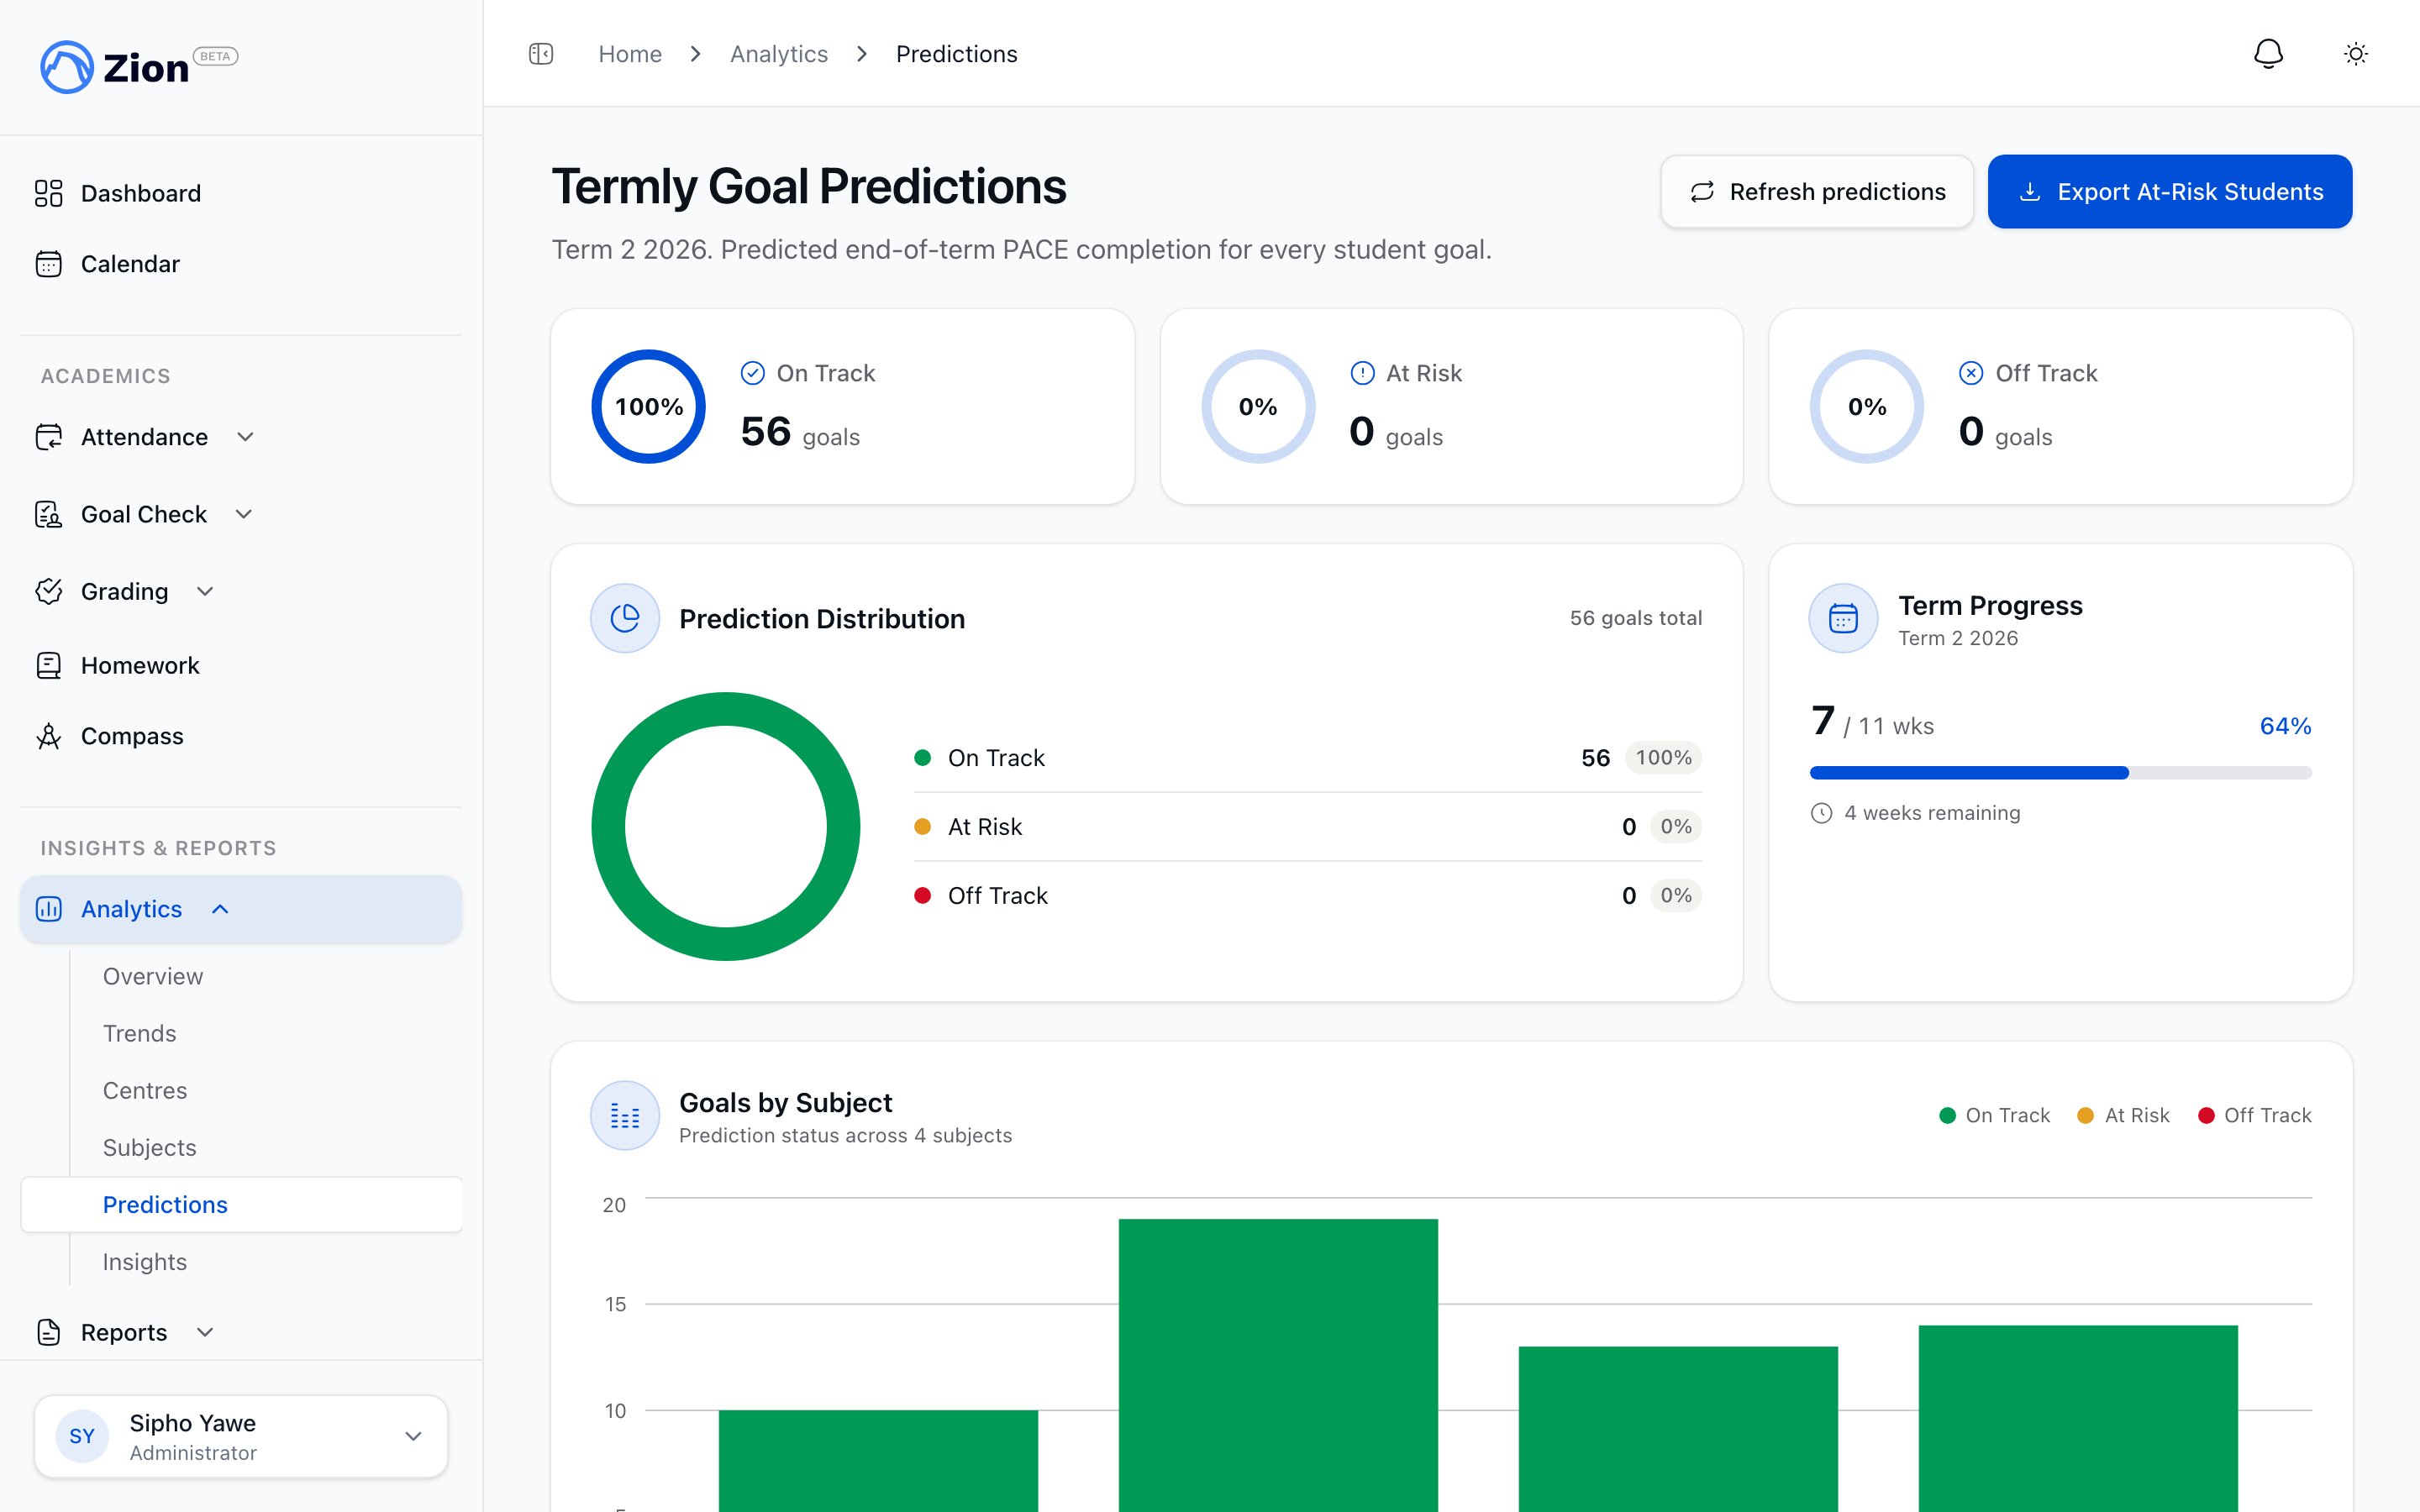
The predictions dashboard with a status donut chart and searchable, filterable student cards.
Exporting at-risk students
1
Filter if needed
Narrow the dashboard by centre or subject first if you only want a subset.
2
Export
Select Export At-Risk Students to download a CSV listing every student and subject currently classified as at risk or off track.
Same numbers in My Progress
Predictions on the admin and supervisor dashboards, and the termly-goal projection shown to a parent or student in My Progress, are computed by the same underlying calculation. A parent viewing their child’s projection sees the identical status and projected PACE count that an administrator would see for that student, not a separate estimate. Parents and students only see their own child’s or their own record. Neither view offers editing, export, or cross-student visibility.Insights Overview
See how predictions fit alongside trends, breakdowns, and pattern insights.
Analytics Types
Compare the different analytics surfaces available to admins and supervisors.
Your Child's Progress
How parents read My Progress, including the termly-goal projection.
Goal Check Overview
The daily goal data that feeds every trend, breakdown, and prediction.